Point Clare - Tascott - Koolewong - Woy Woy Bay
Household type
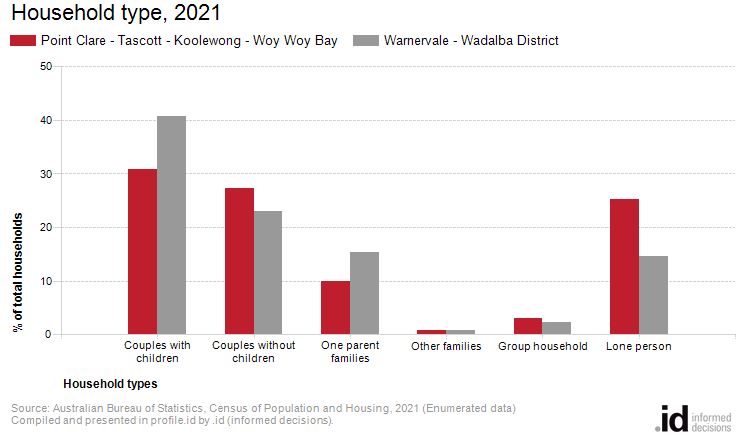
In Point Clare - Tascott - Koolewong - Woy Woy Bay, 30.8% of households were made up of couples with children in 2021, compared with 40.7% in Warnervale - Wadalba District.
Point Clare - Tascott - Koolewong - Woy Woy Bay's household and family structure is one of the most important demographic indicators. It reveals the area's residential role and function, era of settlement and provides key insights into the level of demand for services and facilities as most are related to age and household types.
To continue building the story, Point Clare - Tascott - Koolewong - Woy Woy Bay's Household Summary should be viewed in conjunction with Households with Children, Households without Children, Household Size, Age Structure and Dwelling Type.
If you're looking at this data to prepare a housing strategy, learn more here.
Derived from the Census question:
'What is the person's relationship (to each other person in the household)?'
Households
| Household type | ||||||||
|---|---|---|---|---|---|---|---|---|
| Point Clare - Tascott - Koolewong - Woy Woy Bay - Total households (Enumerated) | 2021 | 1996 | Change | |||||
| Households by type | Number | % | Warnervale - Wadalba District % | Number | % | Warnervale - Wadalba District % | 1996 to 2021 | |
| 962 | 30.8 | 40.7 | 897 | 33.0 | 40.2 | +64 | 19500 | |
| 854 | 27.3 | 22.9 | 828 | 30.5 | 24.5 | +25 | 19501 | |
| 313 | 10.0 | 15.3 | 218 | 8.0 | 9.8 | +95 | 19502 | |
| Other families | 24 | 0.8 | 0.8 | 23 | 0.8 | 0.3 | +1 | 19503 |
| 94 | 3.0 | 2.2 | 55 | 2.0 | 2.9 | +39 | 19504 | |
| 787 | 25.2 | 14.7 | 649 | 23.9 | 19.7 | +138 | 19505 | |
| Other not classifiable household | 76 | 2.4 | 3.0 | 33 | 1.2 | 1.4 | +43 | 19506 |
| Visitor only households | 16 | 0.5 | 0.5 | 16 | 0.6 | 1.2 | 0 | 19507 |
| Total households | 3,126 | 100.0 | 100.0 | 2,720 | 100.0 | 100.0 | +405 | |
Source: Australian Bureau of Statistics, Census of Population and Housing (opens a new window) 1996 and 2021. Compiled and presented by .id (opens a new window)(informed decisions).
(Enumerated data)
Compiled and presented in profile.id by .id (informed decisions).
Compiled and presented in profile.id by .id (informed decisions).
Dominant groups
Analysis of the household/family types in Point Clare - Tascott - Koolewong - Woy Woy Bay in 2021 compared to Warnervale - Wadalba District shows that there was a lower proportion of couple families with child(ren) as well as a lower proportion of one-parent families. Overall, 30.8% of total families were couple families with child(ren), and 10.0% were one-parent families, compared with 40.7% and 15.3% respectively for Warnervale - Wadalba District.
There were a higher proportion of lone person households and a higher proportion of couples without children. Overall, the proportion of lone person households was 25.2% compared to 14.7% in Warnervale - Wadalba District while the proportion of couples without children was 27.3% compared to 22.9% in Warnervale - Wadalba District.
Emerging groups
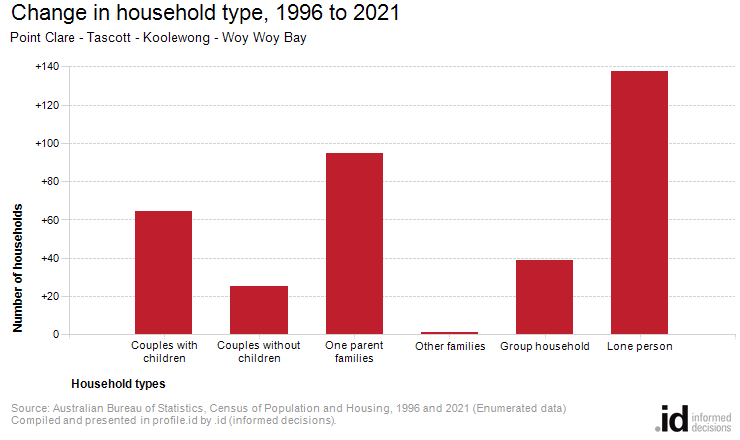
The number of households in Point Clare - Tascott - Koolewong - Woy Woy Bay increased by 406 between 1996 and 2021.
The largest changes in family/household types in Point Clare - Tascott - Koolewong - Woy Woy Bay between 1996 and 2021 were:
- Lone person (+138 households)
- One parent families (+95 households)
- Couples with children (+64 households)