Reynella East
Overseas arrivals
373 people who were living in Reynella East in 2021 were born overseas, and 3% arrived in Australia within 5 years prior to 2021.
The Year of Arrival data records when the overseas born population arrived in Australia. The data shows the degree to which areas are 'ports' for new overseas arrivals and reveals the role of Reynella East in housing the overseas-born. The number of recent overseas arrivals in an area is often determined by housing affordability, employment opportunities and pre-existing communities located in the area.
Reynella East's Year of Arrival data, when used with Birthplace, Religion and Language Spoken at Home data, is a good indicator of the likely need for services in migrant communities.
Derived from the Census question:
'In what year did the person first arrive in Australia to live here for one year or more?'
Overseas born population
| Overseas arrivals | ||||
|---|---|---|---|---|
| Reynella East - Overseas born (Usual residence) | 2021 | |||
| Year of arrival in Australia | Number | % | Port Noarlunga South % | |
| Arrived in 1960 or earlier | 42 | 11.3 | 9.0 | 100 |
| 1961 to 1970 | 73 | 19.6 | 22.1 | 110 |
| 1971 to 1980 | 45 | 12.1 | 17.5 | 120 |
| 1981 to 1990 | 49 | 13.1 | 10.1 | 130 |
| 1991 to 2000 | 42 | 11.3 | 5.9 | 140 |
| 2001 to 2010 | 81 | 21.7 | 16.2 | 150 |
| 2011 to 2015 | 21 | 5.6 | 9.5 | 160 |
| 2016 to Aug 2021 | 12 | 3.2 | 7.4 | 170 |
| Not stated | 8 | 2.1 | 2.5 | 415 |
| Total | 373 | 100.0 | 100.0 | |
Source: Australian Bureau of Statistics, Census of Population and Housing (opens a new window) 2021. Compiled and presented by .id (opens a new window)(informed decisions).
Compiled and presented in profile.id by .id (informed decisions).
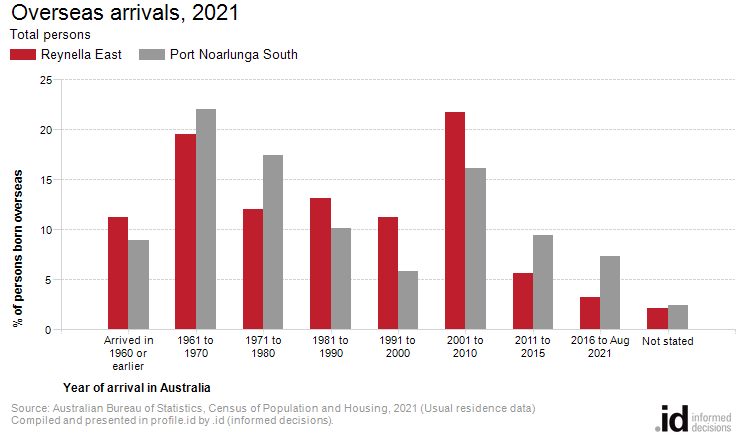
Dominant groups
Analysis of the year of arrival for the overseas born population of Reynella East in 2021 compared to Port Noarlunga South shows that there was a larger proportion of people who arrived before 2001, and a smaller proportion of recent overseas arrivals (those who arrived between 2016 to Aug 2021).
Overall, 67.2922% of the overseas born population arrived before 2001, and 3.2172% arrived during or after 2016, compared with 64.5425% and 7.3529% respectively for Port Noarlunga South.
The major differences in year of arrival data in the population between Reynella East and Port Noarlunga South are:
- A larger percentage of arrivals between 2001 to 2010 (21.7% compared to 16.2%)
- A larger percentage of arrivals between 1991 to 2000 (11.3% compared to 5.9%)
- A smaller percentage of arrivals between 1971 to 1980 (12.1% compared to 17.5%)
- A smaller percentage of arrivals between 2016 to Aug 2021 (3.2% compared to 7.4%)