Happy Valley
Housing loan quartiles
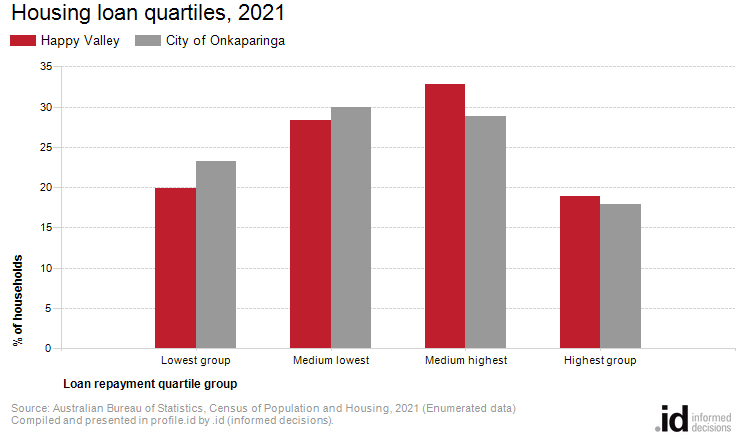
In Happy Valley, the 'medium highest group' was the largest quartile, comprising of 33% of households with mortgages in 2021.
Mortgage repayments in Happy Valley are directly related to house prices, length of occupancy and the level of equity of home owners. When viewed with Household Income data it may also indicate the level of housing stress in the community.
The quartile method is the most objective method of comparing change in the mortgage payment profile of a community over time.
A detailed explanation of how Housing Loan Repayment quartiles are calculated and interpreted is available in specific data notes.
Please note, interest rates at the 2021 Census were at a record low in Australia. The first interest rate rises by the Reserve Bank began an upward cycle from May 2022. Please use mortgage payment data with caution as data from the 2021 Census pre-dates all official rate rises in the current cycle.
Derived from the Census questions:
'How much does your household pay for this dwelling?' and 'Is this dwelling (owned outright, owned with a mortgage etc.)'
Households with a mortgage
| Housing loan quartiles | ||||||||
|---|---|---|---|---|---|---|---|---|
| Happy Valley - Households (Enumerated) | 2021 | 2016 | Change | |||||
| Loan repayment quartile group | Number | % | City of Onkaparinga % | Number | % | City of Onkaparinga % | 2016 to 2021 | |
| Lowest group | 398 | 19.9 | 23.3 | 414 | 21.9 | 23.8 | -16 | 34001 |
| Medium lowest | 568 | 28.4 | 29.9 | 473 | 25.0 | 27.5 | +95 | 34002 |
| Medium highest | 657 | 32.8 | 28.9 | 616 | 32.6 | 29.6 | +41 | 34003 |
| Highest group | 379 | 18.9 | 17.9 | 390 | 20.6 | 19.1 | -11 | 34004 |
| Total households with stated mortgage repayments | 2,004 | 100.0 | 100.0 | 1,895 | 100.0 | 100.0 | +109 | |
Source: Australian Bureau of Statistics, Census of Population and Housing (opens a new window) 2016 and 2021. Compiled and presented by .id (opens a new window)(informed decisions).
(Enumerated data)
| Housing loan - Quartile group dollar ranges | ||||||
|---|---|---|---|---|---|---|
| Calculated from loan repayment data for [theQBMQuartile] | Monthly housing loan repayments by Census year | |||||
| Housing loan repayment ranges | 2021 | 2016 | 2011 | 2006 | 2001 | |
| Lowest group | $0 to $1,023 | $0 to $964 | $0 to $936 | $0 to $670 | $0 to $488 | |
| Medium lowest | $1,024 to $1,499 | $965 to $1,470 | $937 to $1,478 | $671 to $1,038 | $489 to $701 | |
| Medium highest | $1,500 to $2,073 | $1,471 to $2,051 | $1,479 to $2,094 | $1,039 to $1,477 | $702 to $966 | |
| Highest group | $2,074 and over | $2,052 and over | $2,095 and over | $1,478 and over | $967 and over | |
Compiled and presented in profile.id by .id (informed decisions).
Compiled and presented in profile.id by .id (informed decisions).
Dominant groups
Housing loan repayment quartiles allow us to compare relative repayment liabilities across time. Analysis of the distribution of households by housing loan repayment quartiles in Happy Valley compared to the City of Onkaparinga shows that there was a larger proportion of households in the highest repayment quartile, and a smaller proportion in the lowest repayment quartile.
Emerging groups
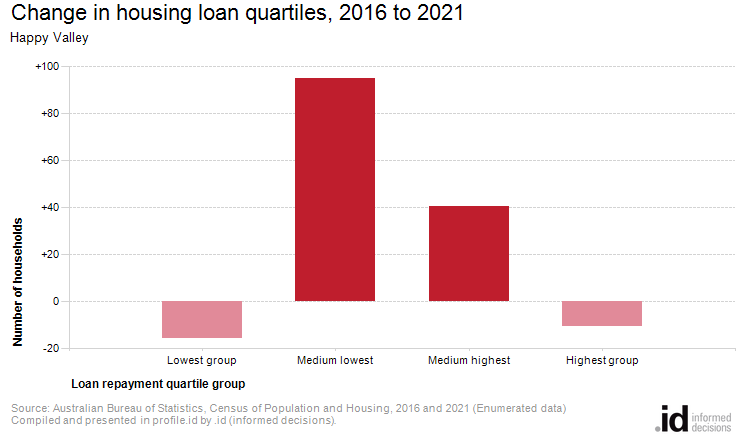
The total number of households with a mortgage in Happy Valley decreased by 1,895 between 2016 and 2021. The most significant change in Happy Valley during this period was in the medium lowest quartile which showed an increase of 95 households.