City of Onkaparinga
Household size
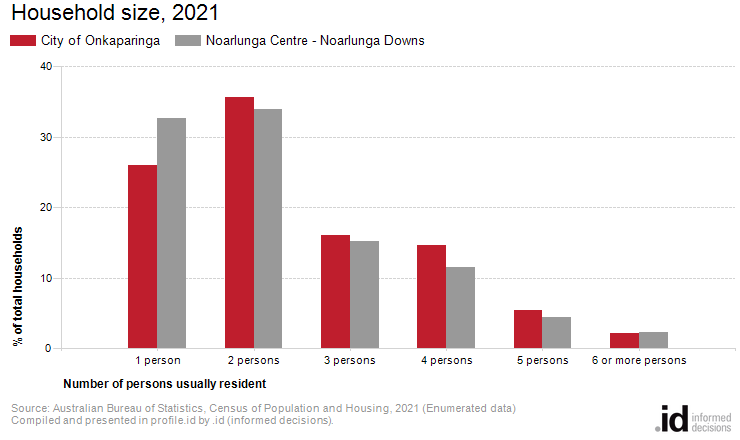
In 2021, 26% of households in the City of Onkaparinga contained only one person, compared with 32.7% in Noarlunga Centre - Noarlunga Downs, with the most dominant household size being 2 persons per household.
The size of households in general follows the life-cycle of families. Households are usually small at the stage of relationship formation (early marriage), and then increase in size with the advent of children. They later reduce in size again as these children reach adulthood and leave home. Household size can also be influenced by a lack (or abundance) of affordable housing. Overseas migrants and indigenous persons often have a tradition of living with extended family members which significantly affects household size.
Household size in Australia has generally declined since the 1970s, but the rate of decline has slowed in recent years.
An increasing household size in an area may indicate a lack of affordable housing opportunities for young people, an increase in the birth rate or an increase in family formation in the area. A declining household size may indicate children leaving the area when they leave home, an increase in retirees settling in the area, or an attraction of young singles and couples to the area.
For greater insight, the City of Onkaparinga's Household Size data should be viewed in conjunction with Household Summary, Age Structure, Dwelling Type, Household Income and Language Spoken at Home.
Derived from the three Census questions:
'Name of each person including visitors who spent the night of Tuesday, 10 August 2021 in this dwelling', and 'Where does the person usually live?', and 'Name of each person who usually lives in this dwelling but was away on Tuesday, 10 August 2021.'
Family, group and lone person households
| Household size | ||||||||
|---|---|---|---|---|---|---|---|---|
| City of Onkaparinga - Households (Enumerated) | 2021 | 1996 | Change | |||||
| Number of persons usually resident | Number | % | Noarlunga Centre - Noarlunga Downs % | Number | % | Noarlunga Centre - Noarlunga Downs % | 1996 to 2021 | |
| 1 person | 17,738 | 26.0 | 32.7 | 8,984 | 18.1 | 25.7 | +8,753 | 20001 |
| 2 persons | 24,288 | 35.6 | 33.9 | 16,525 | 33.2 | 29.6 | +7,762 | 20002 |
| 3 persons | 10,980 | 16.1 | 15.1 | 8,960 | 18.0 | 18.3 | +2,019 | 20003 |
| 4 persons | 10,002 | 14.7 | 11.5 | 10,206 | 20.5 | 16.4 | -205 | 20004 |
| 5 persons | 3,707 | 5.4 | 4.4 | 3,828 | 7.7 | 6.9 | -121 | 20005 |
| 6 or more persons | 1,430 | 2.1 | 2.3 | 1,268 | 2.5 | 3.2 | +161 | 20006 |
| Total classifiable households | 68,145 | 100.0 | 100.0 | 49,774 | 100.0 | 100.0 | +18,370 | |
Source: Australian Bureau of Statistics, Census of Population and Housing (opens a new window) 1996 and 2021. Compiled and presented by .id (opens a new window)(informed decisions).
| Household size - Summary | ||||||||
|---|---|---|---|---|---|---|---|---|
| City of Onkaparinga - Enumerated | 2021 | 1996 | Change | |||||
| Dwellings | Number | % | Noarlunga Centre - Noarlunga Downs % | Number | % | Noarlunga Centre - Noarlunga Downs % | 1996 to 2021 | |
| Occupied private dwellings | 70,520 | -- | -- | 2002 | 50,655 | -- | -- | +19,865 |
| Persons in occupied private dwellings | 170,422 | -- | -- | 2003 | 138,466 | -- | -- | +31,956 |
| Average household size (persons per dwelling) | 2.42 | -- | 2.28 | 2004.00 | 2.73 | -- | 2.62 | -0.32 |
Source: Australian Bureau of Statistics, Census of Population and Housing(opens a new window) 1996 and 2021. Compiled and presented in profile.id by .id (opens a new window)(informed decisions).
The 'Dwellings' table is enumerated data.
Compiled and presented in profile.id by .id (informed decisions).
Compiled and presented in profile.id by .id (informed decisions).
Dominant groups
Analysis of the number of persons usually resident in a household in the City of Onkaparinga compared with Noarlunga Centre - Noarlunga Downs shows that there were a lower proportion of lone person households, and a higher proportion of larger households (those with 4 persons or more). Overall there were 26.0% of lone person households, and 22.2% of larger households, compared with 32.7% and 18.3% respectively for Noarlunga Centre - Noarlunga Downs.
The major differences in the household size for the City of Onkaparinga and Noarlunga Centre - Noarlunga Downs were:
- A larger percentage of households with 4 persons usually resident (14.7% compared to 11.5%)
- A larger percentage of households with 2 persons usually resident (35.6% compared to 33.9%)
- A larger percentage of households with 5 persons usually resident (5.4% compared to 4.4%)
- A smaller percentage of households with 1 person usually resident (26.0% compared to 32.7%)
Emerging groups
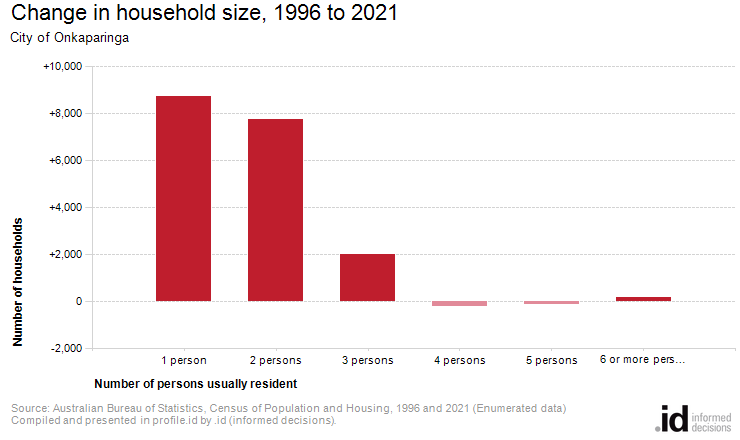
The number of households in City of Onkaparinga increased by 18,371 between 1996 and 2021.
The largest changes in the number of persons usually resident in a household in the City of Onkaparinga between 1996 and 2021 were:
- 1 person (+8,753 households)
- 2 persons (+7,762 households)
- 3 persons (+2,019 households)
- 4 persons (-205 households)