Keilor
Occupation of employment
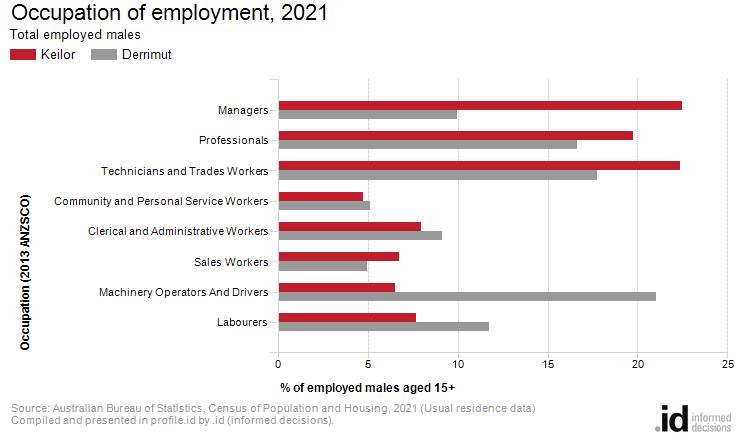
There were more male managers in Keilor in 2021 than any other occupation.
Keilor's occupation statistics quantify the occupations in which the residents work (which may be within the residing area or elsewhere). This will be influenced by the economic base and employment opportunities available in the area, education levels, and the working and social aspirations of the population. When viewed with other indicators, such as Educational Qualifications and Individual Income, Occupation is a key measure for evaluating Keilor's socio-economic status and skill base.
Derived from the two Census questions:
'In the main job held last week, what was the person's occupation?' and 'What are the main tasks that the person himself/herself usually performs in that occupation?'
Employed persons aged 15 years and over
| Occupation of employment | ||||||||
|---|---|---|---|---|---|---|---|---|
| Keilor - Employed males (Usual residence) | 2021 | 2006 | Change | |||||
| Occupation | Number | % | Derrimut % | Number | % | Derrimut % | 2006 to 2021 | |
| Managers | 328 | 22.5 | 10.0 | 317 | 19.6 | 10.1 | +11 | 15001 |
| Professionals | 288 | 19.8 | 16.6 | 277 | 17.1 | 12.4 | +10 | 15002 |
| 326 | 22.4 | 17.8 | 372 | 23.0 | 22.1 | -46 | 15003 | |
| Community and Personal Service Workers | 69 | 4.7 | 5.1 | 78 | 4.9 | 3.8 | -10 | 15004 |
| Clerical and Administrative Workers | 116 | 8.0 | 9.2 | 111 | 6.9 | 7.0 | +4 | 15005 |
| Sales Workers | 98 | 6.7 | 5.0 | 152 | 9.4 | 6.8 | -55 | 15006 |
| Machinery Operators And Drivers | 95 | 6.5 | 21.0 | 139 | 8.6 | 22.1 | -44 | 15007 |
| 112 | 7.7 | 11.7 | 128 | 7.9 | 15.0 | -16 | 15008 | |
| Not stated or inadequately described | 35 | 2.4 | 3.3 | 41 | 2.6 | 0.7 | -7 | 15009 |
| Total employed persons aged 15+ | 1,458 | 100.0 | 100.0 | 1,619 | 100.0 | 100.0 | -161 | |
Source: Australian Bureau of Statistics, Census of Population and Housing (opens a new window) 2006 and 2021. Compiled and presented by .id (opens a new window)(informed decisions).
(Usual residence data)
Compiled and presented in profile.id by .id (informed decisions).
Compiled and presented in profile.id by .id (informed decisions).
Dominant groups
An analysis of the jobs held by the male resident population in Keilor in 2021 shows the three most popular occupations were:
- Managers (328 males or 22.5%)
- Technicians and Trades Workers (326 males or 22.4%)
- Professionals (288 males or 19.8%)
In combination these three occupations accounted for 942 males in total or 64.6% of the employed male resident population.
In comparison, Derrimut employed 10.0% in Managers; 17.8% in Technicians and Trades Workers; and 16.6% in Professionals.
The major differences between the jobs held by the male population of Keilor and Derrimut were:
- A larger percentage of males employed as Managers (22.5% compared to 10.0%)
- A larger percentage of males employed as Technicians and Trades Workers (22.4% compared to 17.8%)
- A smaller percentage of males employed as Machinery Operators And Drivers (6.5% compared to 21.0%)
- A smaller percentage of males employed as Labourers (7.7% compared to 11.7%)
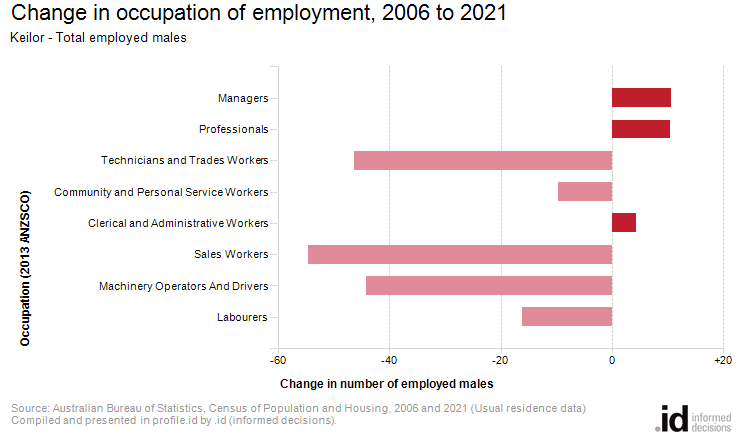
Emerging groups
The number of employed males in Keilor decreased by 161 between 2006 and 2021.
The largest change in the occupations of male residents between 2006 and 2021 in Keilor was for those employed as:
- Sales Workers (-55 males)