Hillbank
Religion
In Hillbank in 2016, the largest religious group was Western (Roman) Catholic (18.8% of all people), while 37.4% of people had no religion and 6.3% did not answer the question on religion.
Hillbank's religion statistics provide an indicator of cultural identity and ethnicity when observed in conjunction with other key variables. Religion data reveal the major concentrations of religions as well as revealing the proportion of people with no religious affiliation. There are a number of reasons for different religious compositions across areas including the country of birth and ethnic background of the population, the age of the population (belief in religion is generally stronger, the older the population) and changes in values and belief systems.
Hillbank's religion statistics should be analysed in conjunction with other ethnicity statistics such as Country of Birth data and Language Spoken data to assist in identifying specific cultural and ethnic groups.
Please note: Due to changes in ABS rules around perturbation and additivity of data to protect the confidentiality of individuals, counts of individual religion groups and totals derived from them may differ slightly from those published by the ABS.
Derived from the Census question:
'What is the person's religion?'
Total population
| Religion - Summary | ||||||||
|---|---|---|---|---|---|---|---|---|
| Hillbank - Total persons (Usual residence) | 2016 | 2001 | Change | |||||
| Religion totals | Number | % | Elizabeth Grove % | Number | % | Elizabeth Grove % | 2001 to 2016 | |
| 2,391 | 51.9 | 39.9 | 35500 | 2,876 | 61.6 | 55.4 | -485 | |
| 162 | 3.5 | 10.7 | 35501 | 70 | 1.5 | 1.0 | +92 | |
| Non-classifiable religious belief | 39 | 0.8 | 0.7 | 35502 | 127 | 2.7 | 2.3 | -88 |
| 1,726 | 37.4 | 35.8 | 35503 | 1,132 | 24.2 | 28.5 | +594 | |
| Not stated | 292 | 6.3 | 12.9 | 35504 | 466 | 10.0 | 12.7 | -174 |
| Total Population | 4,610 | 100.0 | 100.0 | 4,671 | 100.0 | 100.0 | -61 | |
Source: Australian Bureau of Statistics, Census of Population and Housing (opens a new window) 2001 and 2016. Compiled and presented by .id (opens a new window)(informed decisions).
(Usual residence data)
| Religion - Ranked by size | ||||||||
|---|---|---|---|---|---|---|---|---|
| Hillbank - Total persons (Usual residence) | 2016 | 2001 | Change | |||||
| Religion | Number | % | Elizabeth Grove % | Number | % | Elizabeth Grove % | 2001 to 2016 | |
| Western (Roman) Catholic | 868 | 18.8 | 11.1 | 35044 | 1,067 | 22.8 | 17.3 | -199 |
| Anglican | 673 | 14.6 | 10.6 | 35000 | 860 | 18.4 | 16.4 | -187 |
| Uniting Church | 254 | 5.5 | 3.6 | 35043 | 363 | 7.8 | 6.6 | -109 |
| Other Christian | 181 | 3.9 | 3.7 | 35027 | 16 | 0.3 | 0.2 | +165 |
| Pentecostal | 90 | 2.0 | 1.0 | 35033 | 48 | 1.0 | 1.7 | +42 |
| Lutheran | 90 | 2.0 | 1.8 | 35021 | 113 | 2.4 | 1.9 | -23 |
| Islam | 57 | 1.2 | 6.5 | 35017 | 0 | 0.0 | -- | +57 |
| Baptist | 53 | 1.1 | 2.9 | 35006 | 75 | 1.6 | 2.3 | -22 |
| Buddhism | 50 | 1.1 | 1.1 | 35008 | 54 | 1.2 | 0.5 | -4 |
| Greek Orthodox | 45 | 1.0 | 0.7 | 35015 | 30 | 0.6 | 0.6 | +15 |
| Presbyterian and Reformed | 44 | 1.0 | 1.2 | 35036 | 84 | 1.8 | 2.0 | -40 |
| Hinduism | 34 | 0.7 | 2.3 | 35016 | 0 | 0.0 | -- | +34 |
| Seventh Day Adventist | 19 | 0.4 | 0.5 | 35040 | 18 | 0.4 | 0.2 | +1 |
| Other Protestant | 15 | 0.3 | 0.3 | 35034 | 13 | 0.3 | -- | +2 |
| Salvation Army | 11 | 0.2 | 0.4 | 35038 | 19 | 0.4 | 1.0 | -8 |
| Other Non-Christian Religions | 10 | 0.2 | -- | 35031 | 3 | 0.1 | -- | +7 |
| Christadelphian | 10 | 0.2 | -- | 35010 | 12 | 0.3 | 0.2 | -2 |
| Brethren | 10 | 0.2 | -- | 35007 | 8 | 0.2 | 0.1 | +2 |
| Show me more! | ||||||||
Source: Australian Bureau of Statistics, Census of Population and Housing (opens a new window) 2001 and 2016. Compiled and presented by .id (opens a new window)(informed decisions).
Excludes religions with fewer than 10 adherents.
Compiled and presented in profile.id by .id (informed decisions).
Compiled and presented in profile.id by .id (informed decisions).
Dominant groups
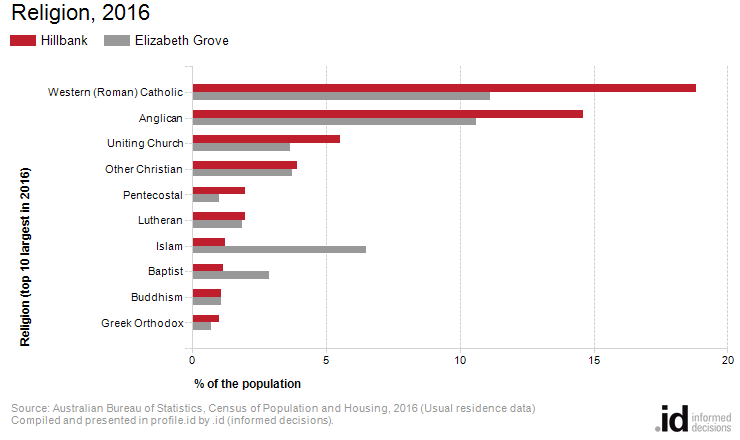
Analysis of the religious affiliation of the population of Hillbank in 2016 compared to Elizabeth Grove shows that there was a higher proportion of people who professed a religion as well as a higher proportion who stated they had no religion.
Overall, 55.4% of the population nominated a religion, and 37.4% said they had no religion, compared with 50.6% and 35.8% respectively for Elizabeth Grove.
The largest single religion in Hillbank was Western (Roman) Catholic, with 18.8% of the population or 868 people as adherents.
The major differences between the religious affiliation for the population of Hillbank and Elizabeth Grove were:
- A larger percentage who nominated Western (Roman) Catholic (18.8% compared to 11.1%)
- A larger percentage who nominated Anglican (14.6% compared to 10.6%)
- A larger percentage who nominated Uniting Church (5.5% compared to 3.6%)
- A smaller percentage who nominated Islam (1.2% compared to 6.5%)
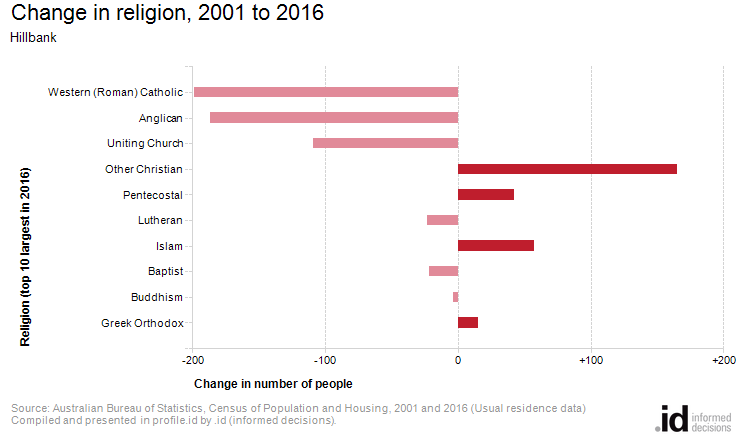
Emerging groups
The largest changes in the religious affiliation of the population in Hillbank between 2001 and 2016 were for those who nominated:
- Western (Roman) Catholic (-199 persons)
- Anglican (-187 persons)
- Other Christian (+165 persons)
- Uniting Church (-109 persons)