Central Ward
Housing rental quartiles
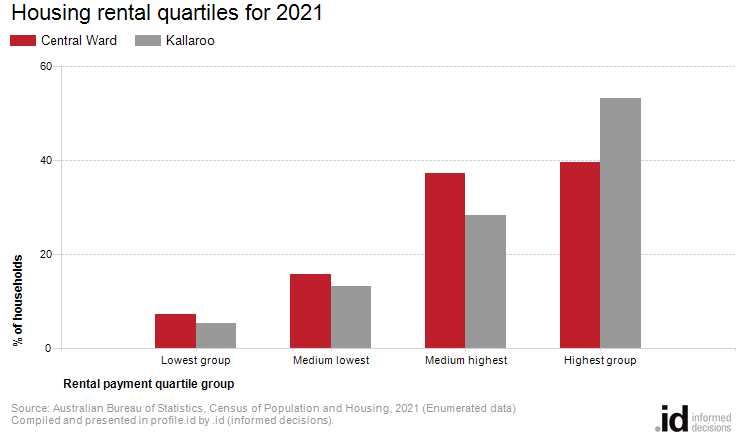
In Central Ward, the 'highest group' was the largest quartile, comprising 40% of renting households in 2021.
Rental payments in Central Ward are indicative of its residential role and function and are directly related to the value of residential property. When viewed with Household Income data they may also indicate the level of 'housing stress' in the community.
The quartile method is the most objective method of comparing change in the rental costs of a community over time.
A detailed explanation of how Housing Rental Payment quartiles are calculated and interpreted is available in specific data notes.
Derived from the Census questions:
'How much does your household pay for this dwelling?' and 'Is this dwelling (owned outright, owned with a mortgage etc.)'
Households renting their dwelling
| Housing rental quartiles | ||||||||
|---|---|---|---|---|---|---|---|---|
| Central Ward - Households (Enumerated) | 2021 | 2016 | Change | |||||
| Quartile group | Number | % | Kallaroo % | Number | % | Kallaroo % | 2016 to 2021 | |
| Lowest group | 104 | 7.3 | 5.3 | 113 | 8.4 | 3.4 | -10 | 33001 |
| Medium lowest | 226 | 15.9 | 13.2 | 196 | 14.6 | 13.4 | +30 | 33002 |
| Medium highest | 532 | 37.3 | 28.4 | 477 | 35.3 | 31.4 | +55 | 33003 |
| Highest group | 565 | 39.5 | 53.1 | 562 | 41.7 | 51.9 | +2 | 33004 |
| Total households with stated rent | 1,429 | 100.0 | 100.0 | 1,351 | 100.0 | 100.0 | +78 | |
Source: Australian Bureau of Statistics, Census of Population and Housing (opens a new window) 2016 and 2021. Compiled and presented by .id (opens a new window)(informed decisions).
(Enumerated data)
| Housing rental - Quartile group dollar ranges | |||||
|---|---|---|---|---|---|
| Calculated from rental payment data for [theQBMQuartile] | Weekly housing rental payments by Census year | ||||
| Rental payment ranges | 2021 | 2016 | 2011 | 2006 | 2001 |
| Lowest group | $0 to $259 | $0 to $254 | $0 to $200 | $0 to $123 | $0 to $93 |
| Medium lowest | $260 to $345 | $255 to $356 | $201 to $308 | $124 to $176 | $94 to $132 |
| Medium highest | $346 to $429 | $357 to $437 | $309 to $385 | $177 to $230 | $133 to $177 |
| Highest group | $430 and over | $438 and over | $386 and over | $231 and over | $178 and over |
Compiled and presented in profile.id by .id (informed decisions).
Compiled and presented in profile.id by .id (informed decisions).
Dominant groups
Rental payment quartiles allow us to compare relative rental liabilities across time. Analysis of the distribution of households by rental payment quartiles in Central Ward compared to Kallaroo shows that there was a smaller proportion of households in the highest payment quartile, and a larger proportion in the lowest payment quartile.
Emerging groups
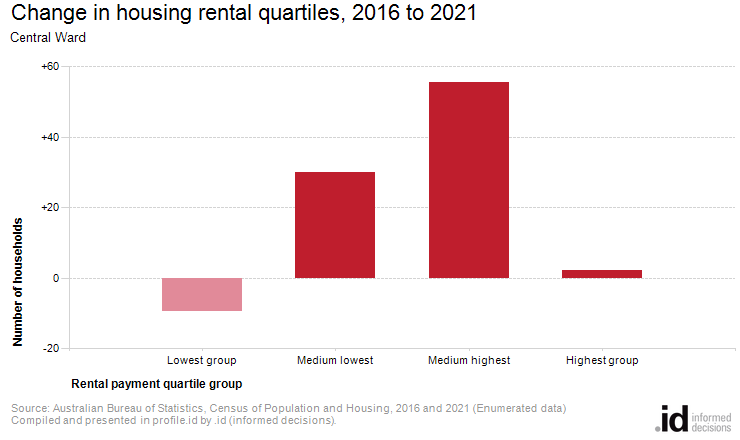
The total number of households renting their dwelling in Central Ward increased by 78 between 2016 and 2021. The most significant change during this period was in the medium highest quartile which showed an increase of 55 households.