Bittern - Crib Point
Method of travel to work
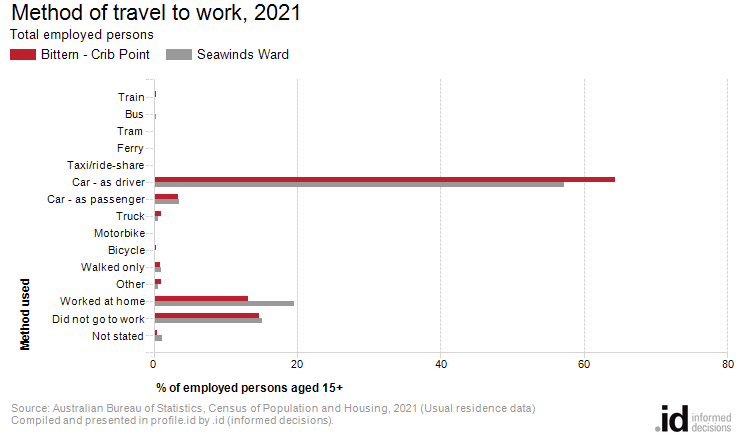
On Census day 2021 in Bittern - Crib Point, 67.7% of people travelled to work in a private car, 0.6% took public transport and 1.2% rode a bike or walked. 13.2% worked at home.
Bittern - Crib Point's commuting statistics reveal the main modes of transport by which residents get to work. There are a number of reasons why people use different modes of transport to get to work including the availability of affordable and effective public transport options, the number of motor vehicles available within a household, and the distance travelled to work.
Commuting data is very useful in transport planning as it informs decision-makers about the availability, effectiveness and utilisation of local transport options, particularly when analysed with Residents Place of Work data and Car Ownership.
WARNING: Method of travel to work relates to Census day, which for the 2021 Census occurred during COVID-19 lockdowns for large parts of Australia. In lockdown, many occupations were required to work from home if possible, and some industries were closed, so people did not go to work. For this reason, these categories may have increased, with corresponding declines in other methods of travel. Use the data with caution when comparing over time. For more details, please refer to the data notes.
Derived from the Census question:
'How did the person get to work on Tuesday, 10 August 2021?'
Employed persons aged 15 years and over
| Method of travel to work | ||||||||
|---|---|---|---|---|---|---|---|---|
| Bittern - Crib Point - Employed persons (Usual residence) | 2021 | 2011 | Change | |||||
| Main method of travel | Number | % | Seawinds Ward % | Number | % | Seawinds Ward % | 2011 to 2021 | |
| Train | 14 | 0.4 | 0.2 | 43 | 1.4 | 0.4 | -29 | 16001 |
| Bus | 6 | 0.2 | 0.4 | 3 | 0.1 | 0.2 | +3 | 16003 |
| Tram | 0 | -- | -- | 0 | -- | -- | 0 | 16005 |
| Ferry | 0 | -- | 0.0 | 0 | -- | -- | 0 | 16006 |
| Taxi/ride-share | 0 | -- | 0.1 | 0 | -- | -- | 0 | 16007 |
| Car - as driver | 2,326 | 64.4 | 57.2 | 2,155 | 70.5 | 69.5 | +170 | 16009 |
| Car - as passenger | 121 | 3.3 | 3.6 | 178 | 5.8 | 5.7 | -58 | 16011 |
| Truck | 39 | 1.1 | 0.6 | 47 | 1.5 | 1.1 | -8 | 16013 |
| Motorbike | 4 | 0.1 | 0.1 | 22 | 0.7 | 0.2 | -18 | 16015 |
| 13 | 0.4 | 0.2 | 17 | 0.6 | 0.5 | -4 | 16017 | |
| 31 | 0.9 | 1.1 | 43 | 1.4 | 2.1 | -12 | 16019 | |
| Other | 35 | 1.0 | 0.7 | 38 | 1.2 | 0.8 | -3 | 16021 |
| 478 | 13.2 | 19.6 | 104 | 3.4 | 4.8 | +373 | 16023 | |
| Did not go to work | 530 | 14.7 | 15.1 | 348 | 11.4 | 12.4 | +182 | 16025 |
| Not stated | 17 | 0.5 | 1.2 | 58 | 1.9 | 2.5 | -42 | 16027 |
| Total employed persons aged 15+ | 3,614 | 100.0 | 100.0 | 3,059 | 100.0 | 100.0 | +555 | |
Source: Australian Bureau of Statistics, Census of Population and Housing (opens a new window) 2011 and 2021. Compiled and presented by .id (opens a new window)(informed decisions).
(Usual residence data)
Compiled and presented in profile.id by .id (informed decisions).
Compiled and presented in profile.id by .id (informed decisions).
Dominant groups
In 2021, there were 20 people who caught public transport to work (train, bus, tram or ferry) in Bittern - Crib Point, compared with 2,490 who drove in private vehicles (car – as driver, car – as passenger, motorbike, or truck).
Analysis of the method of travel to work of the residents in Bittern - Crib Point in 2021, compared to Seawinds Ward, shows that 0.6% used public transport, while 67.7% used a private vehicle, compared with 0.6% and 60.8% respectively in Seawinds Ward.
The major differences in persons between the method of travel to work of Bittern - Crib Point and Seawinds Ward were:
- A larger percentage of persons who travelled by car (as driver) (64.4% compared to 57.2%)
- A smaller percentage of persons who worked at home (13.2% compared to 19.6%)
Emerging groups
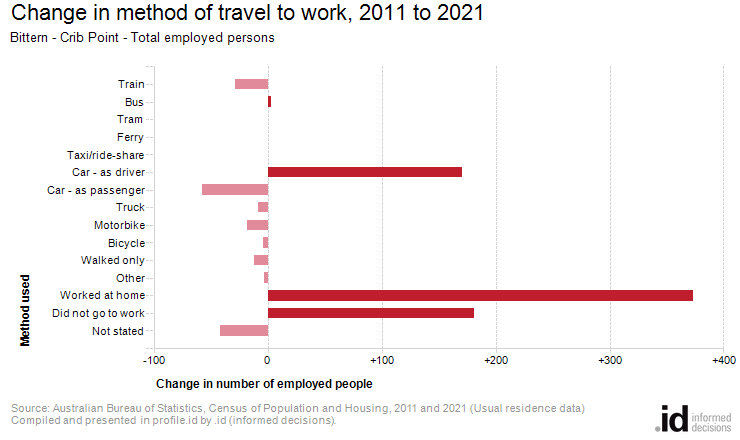
The number of employed people in Bittern - Crib Point increased by 555 between 2011 and 2021.
The largest changes in the method of travel to work by resident population in Bittern - Crib Point between 2011 and 2021 were for those nominated:
- Worked at home (+373 persons)
- Did not go to work (+182 persons)
- Car - as driver (+170 persons)
- Car - as passenger (-58 persons)