Tyabb
Number of cars per household
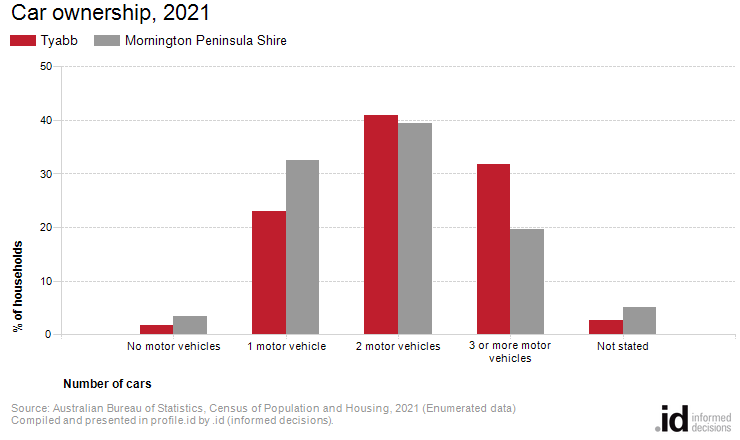
Analysis of car ownership in 2021, indicates 73% of households in Tyabb had access to two or more motor vehicles, compared to 59% in Mornington Peninsula Shire.
The ability of the population to access services and employment is strongly influenced by access to transport. The number of motor vehicles per household in Tyabb quantifies access to private transport and will be influenced by Age Structure and Household Type, which determine the number of adults present; access to Public Transport; distance to shops, services, employment and education; and Household Income. Depending on these factors, car ownership can be seen as a measure of advantage or disadvantage, or a neutral socio-economic measure, which impacts on the environment and quality of life.
Derived from the Census question:
'How many registered motor vehicles owned or used by residents of this dwelling were garaged or parked at or near this dwelling on the night of 10 August 2021?'
Households
| Car ownership | ||||||||
|---|---|---|---|---|---|---|---|---|
| Tyabb - Households (Enumerated) | 2021 | 2011 | Change | |||||
| Number of cars | Number | % | Mornington Peninsula Shire % | Number | % | Mornington Peninsula Shire % | 2011 to 2021 | |
| 21 | 1.7 | 3.5 | 24 | 2.1 | 4.9 | -3 | 26001 | |
| 1 motor vehicle | 292 | 23.0 | 32.4 | 271 | 23.6 | 32.9 | +20 | 26002 |
| 518 | 40.8 | 39.3 | 496 | 43.1 | 39.3 | +21 | 26003 | |
| 3 or more motor vehicles | 404 | 31.8 | 19.6 | 305 | 26.5 | 16.6 | +99 | 26004 |
| Not stated | 34 | 2.7 | 5.2 | 53 | 4.6 | 6.3 | -19 | 26005 |
| Total households | 1,269 | 100.0 | 100.0 | 1,151 | 100.0 | 100.0 | +118 | |
Source: Australian Bureau of Statistics, Census of Population and Housing (opens a new window) 2011 and 2021. Compiled and presented by .id (opens a new window)(informed decisions).
(Enumerated data)
Compiled and presented in profile.id by .id (informed decisions).
Compiled and presented in profile.id by .id (informed decisions).
Dominant groups
Analysis of the car ownership of the households in Tyabb in 2021 compared to Mornington Peninsula Shire shows that 95.7% of the households owned at least one car, while 1.7% did not, compared with 91.3% and 3.5% respectively in Mornington Peninsula Shire.
Of those that owned at least one vehicle, there was a smaller proportion who owned just one car; a larger proportion who owned two cars; and a larger proportion who owned three cars or more.
Overall, 23.0% of the households owned one car; 40.8% owned two cars; and 31.8% owned three cars or more, compared with 32.4%; 39.3% and 19.6% respectively for Mornington Peninsula Shire.
Emerging groups
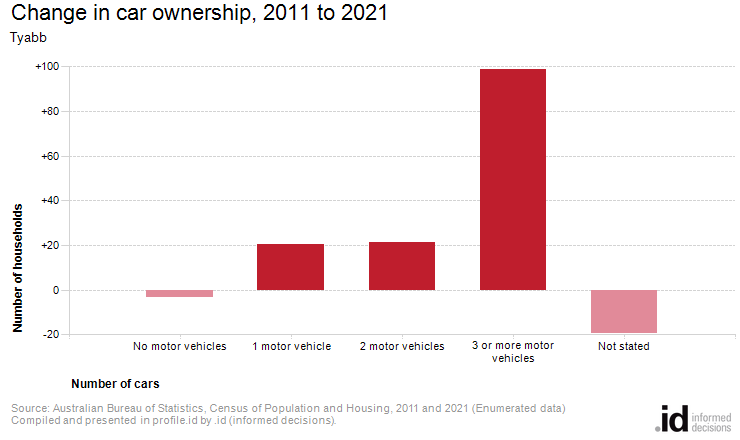
The largest change in the household car ownership in Tyabb between 2011 and 2021 was:
- 3 or more motor vehicles (+99 households)