Fountain Gate Core Catchment
Households with children
There are 13,640 couples with young children in Fountain Gate Core Catchment in 2021, comprising 20.6323% of households.
Households with Children require different services and facilities than other household types, and their needs change as both adults and children age. When many families in an area are at the same stage in their individual lifecycles, it creates a suburb lifecycle. Knowing where a suburb is in a cycle of change helps planners make evidence-based decisions about the demand for services both now and in the future.
For Households with Children in Fountain Gate Core Catchment, life stage is based on the age of children in the household. The age of the parent(s) is not taken into account.
- Young children: Children aged under 15 only
- Mixed age children: One or more children under 15 and one or more children over 15 (must have 2 or more children)
- Older children: Children aged 15 and over only
To continue building the story, Fountain Gate Core Catchment's Household data should be viewed in conjunction with Household Size, Age Structure and Dwelling Type.
Derived from the Census question:
'What is the person's relationship (to each other person in the household)?'
Households
| Households with children by life stage | ||||||||
|---|---|---|---|---|---|---|---|---|
| Fountain Gate Core Catchment - Households (Enumerated) | 2021 | 2016 | Change | |||||
| Households with children | Number | % | Casey Foothills % | Number | % | Casey Foothills % | 2016 to 2021 | |
| 28,819 | 43.6 | 51.0 | 28,372 | 45.7 | 53.6 | +447 | 18500 | |
| Couples with young children | 13,640 | 20.6 | 17.6 | 13,950 | 22.5 | 18.3 | -310 | 18501 |
| Couples with mixed-age children | 4,807 | 7.3 | 8.6 | 4,616 | 7.4 | 9.5 | +191 | 18502 |
| Couples with older children | 10,372 | 15.7 | 24.9 | 9,805 | 15.8 | 25.8 | +566 | 18503 |
| 7,923 | 12.0 | 5.4 | 7,377 | 11.9 | 6.0 | +546 | 18504 | |
| Single parents with young children | 2,500 | 3.8 | 1.6 | 2,238 | 3.6 | 1.0 | +261 | 18505 |
| Single parents with mixed-age children | 985 | 1.5 | 0.8 | 1,055 | 1.7 | 0.5 | -71 | 18506 |
| Single parents with older children | 4,438 | 6.7 | 3.1 | 4,082 | 6.6 | 4.4 | +355 | 18507 |
| Total households with children | 36,742 | 55.6 | 56.5 | 35,749 | 57.6 | 59.6 | +993 | 18508 |
| Total households | 66,110 | 100.0 | 100.0 | 62,093 | 100.0 | 100.0 | +4,016 | |
Source: Australian Bureau of Statistics, Census of Population and Housing (opens a new window) 2016 and 2021. Compiled and presented by .id (opens a new window)(informed decisions).
Compiled and presented in profile.id by .id (informed decisions).
Compiled and presented in profile.id by .id (informed decisions).
Dominant groups
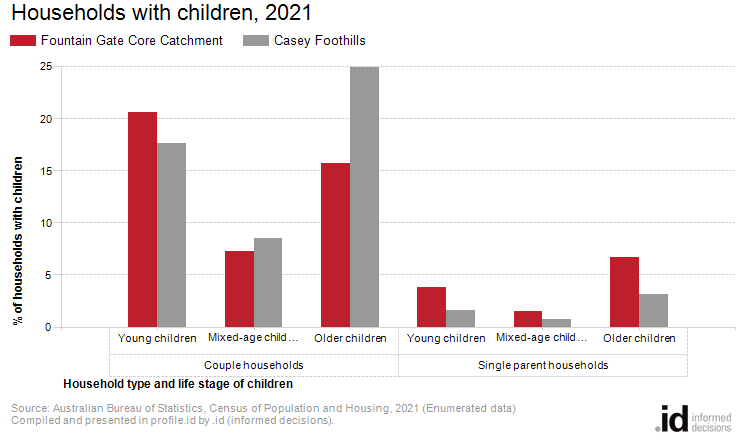
Analysis of the families with children in Fountain Gate Core Catchment in 2021 compared to Casey Foothills shows that there was a larger proportion of couples with young children, and a smaller proportion of couples with older children.
Overall, 20.6% of total households with children were couple with young children, and 15.7% were couples with older children, compared with 17.6% and 24.9% respectively for Casey Foothills.
There were a larger proportion of single parent households with young children and a larger proportion of single parent households with older children. Overall, the proportion of single parent households with young children was 3.8% compared to 1.6% in Casey Foothills while the proportion of single parent households with older children was 6.7% compared to 3.1% in Casey Foothills.
Emerging groups
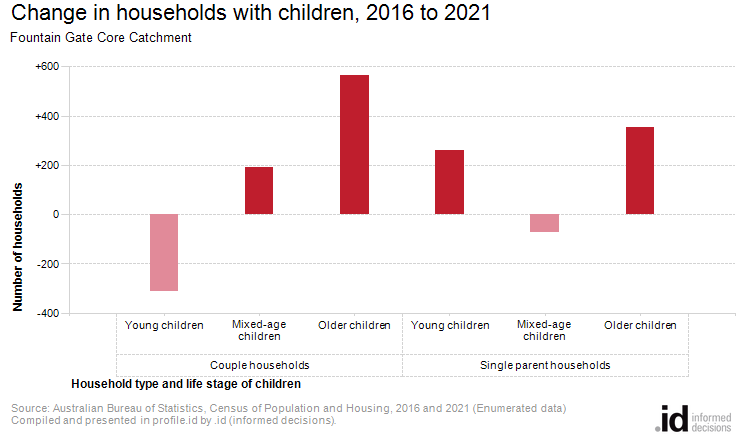
Between 2016 and 2021, the number of households with children increased by 993 households or 2.8%.
The largest changes in households with children in this area between 2016 and 2021 were:
- Couples with older children (+566 households)
- Single parents with older children (+355 households)
- Couples with young children (-310 households)
- Single parents with young children (+261 households)