Penrith City
Individual income quartiles
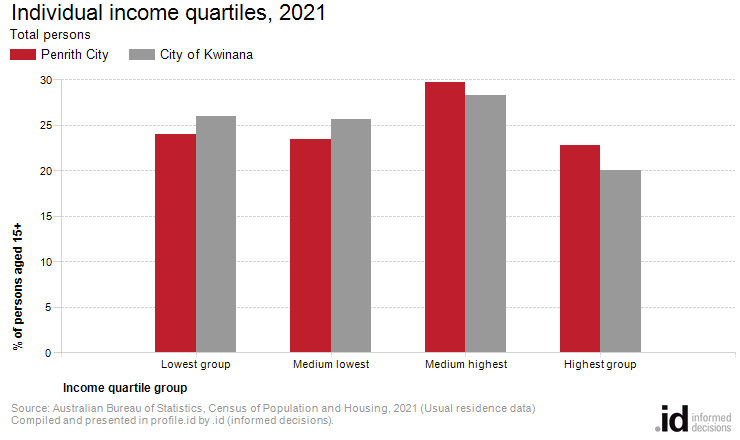
In Penrith City , the 'medium highest' income quartile was the largest group in 2021, comprising 30% of people aged 15 and over.
Penrith City 's income statistics are an indicator of socio-economic status. With other data sources, such as Household Income, Qualifications and Occupation, they help tell the story of the area's economic opportunities and socio-economic status. Individual income levels are not comparable over time because of the influences of economic change such as wage level fluctuations and inflation. The income quartile method is the most objective method of comparing change in the income profile of a community over time.
A detailed explanation of how Individual Income quartiles are calculated and interpreted is available in specific data notes.
Derived from the Census question:
'What is the total of all wages/salaries, government benefits, pensions, allowances and other income the person usually receives?'
Gross amount for persons aged 15 years and over
| Individual income quartiles | ||||||||
|---|---|---|---|---|---|---|---|---|
| Penrith City - Persons aged 15+ (Usual residence) | 2021 | 2001 | Change | |||||
| Quartile group | Number | % | City of Kwinana % | Number | % | City of Kwinana % | 2001 to 2021 | |
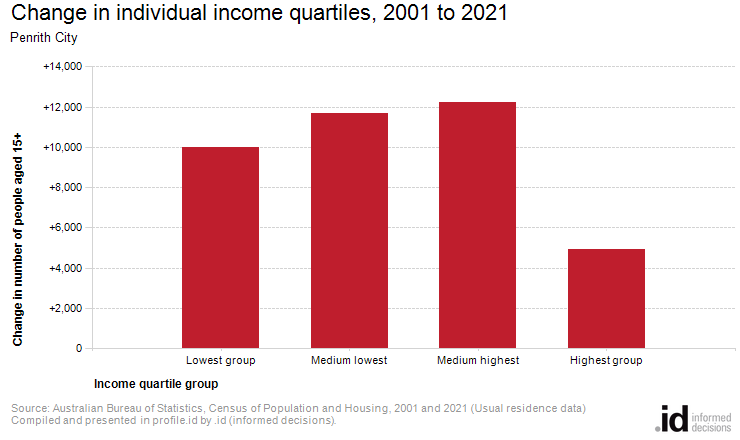
| Lowest group | 38,074 | 24.0 | 26.0 | 28,100 | 23.5 | 27.8 | +9,974 | 30001 |
| Medium lowest | 37,215 | 23.5 | 25.7 | 25,541 | 21.3 | 29.6 | +11,674 | 30002 |
| Medium highest | 47,134 | 29.7 | 28.3 | 34,906 | 29.2 | 25.2 | +12,229 | 30003 |
| Highest group | 36,109 | 22.8 | 20.0 | 31,167 | 26.0 | 17.4 | +4,941 | 30004 |
| Total persons aged 15+ | 158,534 | 100.0 | 100.0 | 119,716 | 100.0 | 100.0 | +38,818 | |
Source: Australian Bureau of Statistics, Census of Population and Housing (opens a new window) 2001 and 2021. Compiled and presented by .id (opens a new window)(informed decisions).
(Usual residence data)
| Individual income - Quartile group dollar ranges | |||||
|---|---|---|---|---|---|
| Calculated from income data for [theQBMQuartile] - Total persons aged 15+ | Weekly income by Census year | ||||
| Individual quartile ranges | 2021 | 2016 | 2011 | 2006 | 2001 |
| Lowest group | $0 to $383 | $0 to $323 | $0 to $271 | $0 to $211 | $0 to $182 |
| Medium lowest | $384 to $805 | $324 to $661 | $272 to $576 | $212 to $466 | $183 to $375 |
| Medium highest | $806 to $1,484 | $662 to $1,229 | $577 to $1,096 | $467 to $877 | $376 to $685 |
| Highest group | $1,485 and over | $1,230 and over | $1,097 and over | $878 and over | $686 and over |
Compiled and presented in profile.id by .id (informed decisions).
Compiled and presented in profile.id by .id (informed decisions).
Dominant groups
Income quartiles allow us to compare relative income-earning capabilities across time. Analysis of the distribution of the population by income quartile in Penrith City compared to the City of Kwinana shows that there was greater proportion of persons in the highest income quartile and a lesser proportion in the lowest income quartile.
Emerging groups
The most significant change in Penrith City in persons between 2001 and 2021 was in the medium highest quartile which showed an increase of 12,229 persons.