Harkness
Housing rental quartiles
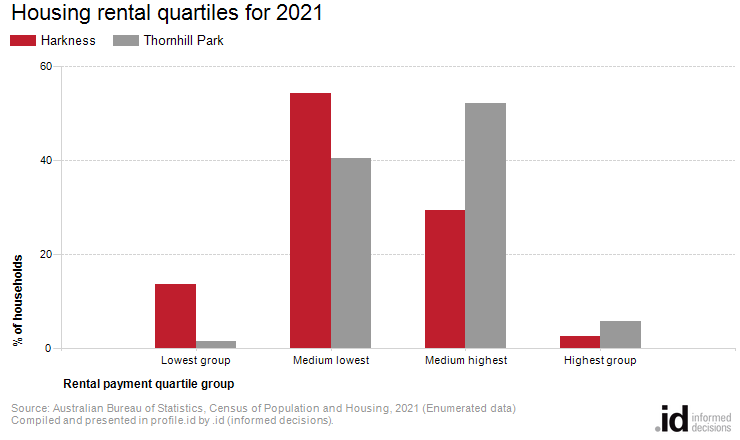
In Harkness, the 'medium lowest group' was the largest quartile, comprising 54% of renting households in 2021.
Rental payments in Harkness are indicative of its residential role and function and are directly related to the value of residential property. When viewed with Household Income data they may also indicate the level of 'housing stress' in the community.
The quartile method is the most objective method of comparing change in the rental costs of a community over time.
A detailed explanation of how Housing Rental Payment quartiles are calculated and interpreted is available in specific data notes.
Derived from the Census questions:
'How much does your household pay for this dwelling?' and 'Is this dwelling (owned outright, owned with a mortgage etc.)'
Households renting their dwelling
| Housing rental quartiles | ||||||||
|---|---|---|---|---|---|---|---|---|
| Harkness - Households (Enumerated) | 2021 | 2001 | Change | |||||
| Quartile group | Number | % | Thornhill Park % | Number | % | Thornhill Park % | 2001 to 2021 | |
| Lowest group | 137 | 13.6 | 1.5 | -- | -- | 30.0 | -- | 33001 |
| Medium lowest | 549 | 54.4 | 40.5 | -- | -- | 26.6 | -- | 33002 |
| Medium highest | 297 | 29.4 | 52.2 | -- | -- | 43.4 | -- | 33003 |
| Highest group | 26 | 2.6 | 5.7 | -- | -- | -- | -- | 33004 |
| Total households with stated rent | 1,011 | 100.0 | 100.0 | 11 | 100.0 | 100.0 | +1,000 | |
Source: Australian Bureau of Statistics, Census of Population and Housing (opens a new window) 2001 and 2021. Compiled and presented by .id (opens a new window)(informed decisions).
(Enumerated data)
| Housing rental - Quartile group dollar ranges | |||||
|---|---|---|---|---|---|
| Calculated from rental payment data for [theQBMQuartile] | Weekly housing rental payments by Census year | ||||
| Rental payment ranges | 2021 | 2016 | 2011 | 2006 | 2001 |
| Lowest group | $0 to $300 | $0 to $256 | $0 to $203 | $0 to $143 | $0 to $109 |
| Medium lowest | $301 to $375 | $257 to $334 | $204 to $286 | $144 to $194 | $110 to $156 |
| Medium highest | $376 to $458 | $335 to $421 | $287 to $365 | $195 to $255 | $157 to $205 |
| Highest group | $459 and over | $422 and over | $366 and over | $256 and over | $206 and over |
Compiled and presented in profile.id by .id (informed decisions).
Compiled and presented in profile.id by .id (informed decisions).
Dominant groups
Rental payment quartiles allow us to compare relative rental liabilities across time. Analysis of the distribution of households by rental payment quartiles in Harkness compared to Thornhill Park shows that there was a smaller proportion of households in the highest payment quartile, and a larger proportion in the lowest payment quartile.