City of Melton
Age groups - Housing tenure
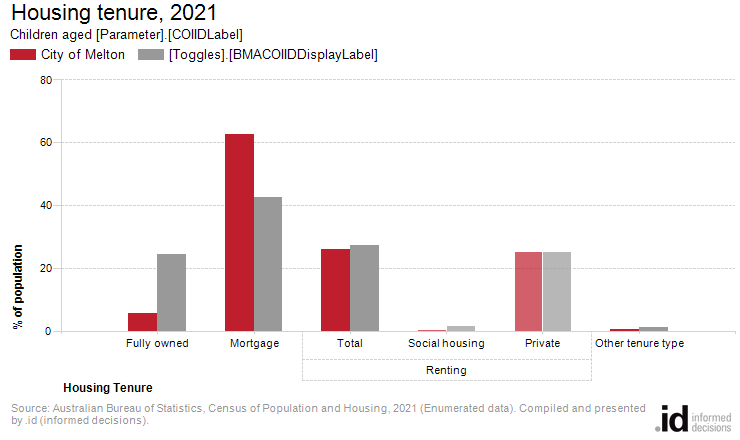
In the City of Melton 68.4% of children aged [Parameter].[COIIDLabel] were in households who were purchasing or fully owned their home, 25.4% were renting privately, and 0.6% were in social housing in 2021.
The City of Melton's Housing Tenure data provides insights into its socio-economic status as well as the role it plays in the housing market.
Looking at tenure for specific age groups provides additional information about the housing role and function, which may be quite different for different age groups. For instance, an inner city area may house predominantly young people, while the elderly are concentrated in public housing. Alternatively, the older population may overwhelmingly own their homes outright, while younger generations are renting due to lack of affordability.
In conjunction with other socio-economic status indicators in the City of Melton, Tenure data is useful for analysing housing markets, housing affordability and identifying public housing areas. It should be looked at alongside Household Type and Dwelling Type.
Please note that the ABS definition of "Rented" in 2021 changed to exclude "Occupied Rent Free", which is now included under "Other tenure type". Please take care when comparing the “Rented” and “Other” categories between 2016 and 2021; most age groups show some increase in the “Other” category due to the definitional change. This represents a very small proportion of the population and has minimal effect on the overall view of tenure by age.
It is also worth remembering that because this table counts individuals, there is no assumption that any particular individual pays the rent or mortgage.
Derived from the Census questions:
'Is this dwelling (owned outright, owned with a mortgage etc.)', and 'If this dwelling is being rented, who is it rented from?'
Children aged [Parameter].[COIIDLabel], counted in private dwellings
| Housing tenure | ||||||||
|---|---|---|---|---|---|---|---|---|
| City of Melton - [Parameter].[COIIDLabel] | 2021 | 2011 | Change | |||||
| Tenure type | Number | % | [Toggles].[BMACOIIDDisplayLabel] | Number | % | [Toggles].[BMACOIIDDisplayLabel] | 2011 to 2021 | |
| Fully owned | 833 | 5.8 | 24.5 | 684 | 6.8 | 27.8 | +149 | 22001 |
| Mortgage | 9,061 | 62.6 | 42.6 | 6,609 | 65.6 | 42.0 | +2,452 | 22002 |
| Renting - Total | 3,784 | 26.2 | 27.3 | 2,253 | 22.4 | 24.5 | +1,531 | 22003 |
| Renting - Social housing | 88 | 0.6 | 1.8 | 108 | 1.1 | 2.4 | -20 | 22004 |
| Renting - Private | 3,668 | 25.4 | 25.4 | 2,117 | 21.0 | 21.7 | +1,551 | 22005 |
| Renting - Not stated | 28 | 0.2 | 0.1 | 20 | 0.2 | 0.4 | +8 | 22006 |
| Other tenure type | 74 | 0.5 | 1.2 | 39 | 0.4 | 0.5 | +35 | 22007 |
| Not stated | 717 | 5.0 | 4.4 | 487 | 4.8 | 5.1 | +230 | 22008 |
| Total people in private dwellings | 14,469 | 100.0 | 100.0 | 10,072 | 100.0 | 100.0 | +4,397 | |
Source: Australian Bureau of Statistics, Census of Population and Housing (opens a new window) 2011 and 2021. Compiled and presented by .id (opens a new window)(informed decisions).
Dominant groups
Analysis of the housing tenure of children aged [Parameter].[COIIDLabel] in the City of Melton in 2021 compared to [Parameter].[BMACOIIDLabel] shows that there was a smaller proportion of children aged [Parameter].[COIIDLabel] in households who owned their dwelling; a larger proportion purchasing their dwelling; and a smaller proportion who were renters.
Overall, 5.8% of children aged [Parameter].[COIIDLabel] were in households who owned their dwelling; 62.6% were purchasing, and 26.2% were renting, compared with 24.5%, 42.6% and 27.3% respectively for [Parameter].[BMACOIIDLabel].
Emerging groups
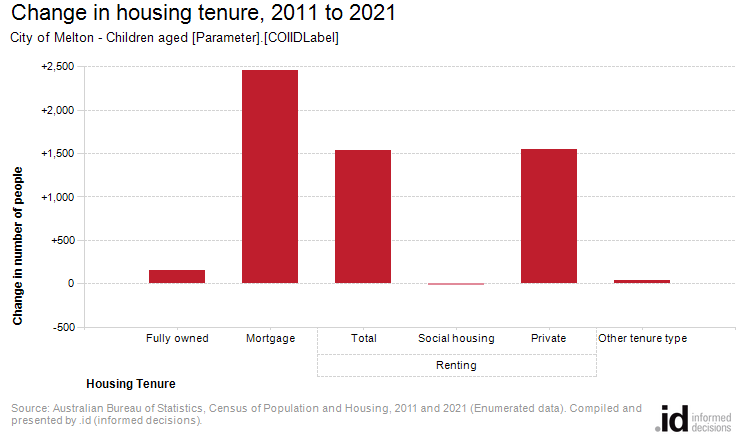
The total number of children aged [Parameter].[COIIDLabel] in households in City of Melton increased by 4,397 between 2011 and 2021.
The largest changes in housing tenure categories for children aged [Parameter].[COIIDLabel] in households in the City of Melton between 2011 and 2021 were:
- Mortgage (+2,452 persons)
- Renting - Private (+1,551 persons)
- Not stated (+230 persons)
- Fully owned (+149 persons)