Black Rock
Service age groups
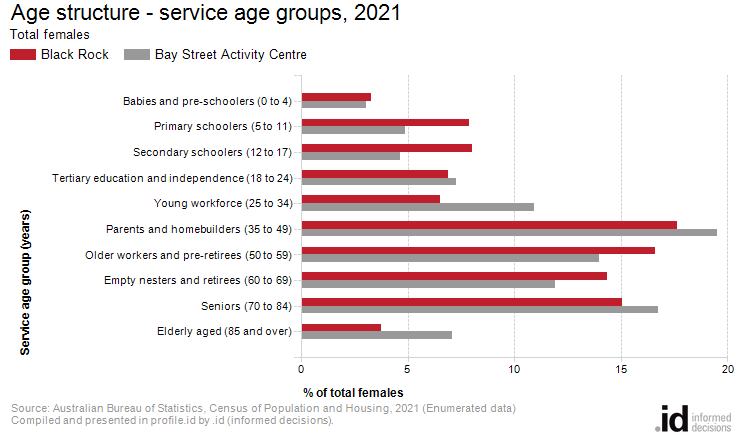
In 2021, Black Rock had higher proportion of female children (under 18) and a lower proportion of females aged 60 or older than Bay Street Activity Centre.
The Age Structure of Black Rock provides key insights into the level of demand for age based services and facilities such as child care. It is an indicator of Black Rock's residential role and function and how it is likely to change in the future.
Service age groups divide the population into age categories that reflect typical life-stages. They indicate the level of demand for services that target people at different stages in life and how that demand is changing.
To get a more complete picture Black Rock's Age Structure should be viewed in conjunction with Household Types and Dwelling Types.
Derived from the Census question:
'What is the person's date of birth or age?'
Total population
| Age structure - Service age groups | |||||||||
|---|---|---|---|---|---|---|---|---|---|
| Black Rock - Total females (Enumerated) | 2021 | 2011 | Change | ||||||
| Service age group (years) | Number | % | Bay Street Activity Centre % | Number | % | Bay Street Activity Centre % | 2011 to 2021 | ||
| 107 | 3.3 | 3.1 | 157 | 5.2 | 6.0 | -50 | 1000 | 1000 | |
| 258 | 7.9 | 4.9 | 274 | 9.0 | 6.6 | -16 | 1001 | 1000 | |
| 262 | 8.0 | 4.6 | 194 | 6.4 | 9.5 | +67 | 1002 | 1000 | |
| 225 | 6.9 | 7.3 | 176 | 5.8 | 5.9 | +49 | 1003 | 1000 | |
| 213 | 6.5 | 10.9 | 271 | 8.9 | 8.3 | -58 | 1004 | 1000 | |
| 576 | 17.6 | 19.5 | 654 | 21.5 | 21.7 | -78 | 1005 | 1000 | |
| 543 | 16.6 | 14.0 | 446 | 14.7 | 11.8 | +96 | 1006 | 1000 | |
| 470 | 14.4 | 11.9 | 392 | 12.9 | 10.7 | +78 | 1007 | 1000 | |
| 493 | 15.1 | 16.8 | 326 | 10.8 | 11.3 | +166 | 1008 | 1000 | |
| 123 | 3.8 | 7.1 | 146 | 4.8 | 8.3 | -23 | 1009 | 1000 | |
| Total | 3,270 | 100.0 | 100.0 | 3,041 | 100.0 | 100.0 | +229 | ||
Source: Australian Bureau of Statistics, Census of Population and Housing (opens a new window) 2011 and 2021. Compiled and presented by .id (opens a new window)(informed decisions).
(Enumerated data)
Compiled and presented in profile.id by .id (informed decisions).
Compiled and presented in profile.id by .id (informed decisions).
Dominant groups
Analysis of the female service age groups of Black Rock in 2021 compared to Bay Street Activity Centre shows that there was a higher proportion of females in the younger age groups (0 to 17 years) and a lower proportion of females in the older age groups (60+ years).
Overall, 19.2% of the female population was aged between 0 and 17, and 33.2% were aged 60 years and over, compared with 12.6% and 35.8% respectively for Bay Street Activity Centre.
The major differences between the female age structure of Black Rock and Bay Street Activity Centre were:
- A larger percentage of 'Secondary schoolers' (8.0% compared to 4.6%)
- A larger percentage of 'Primary schoolers' (7.9% compared to 4.9%)
- A smaller percentage of 'Young workforce' (6.5% compared to 10.9%)
- A smaller percentage of 'Frail aged' (3.8% compared to 7.1%)
Emerging groups
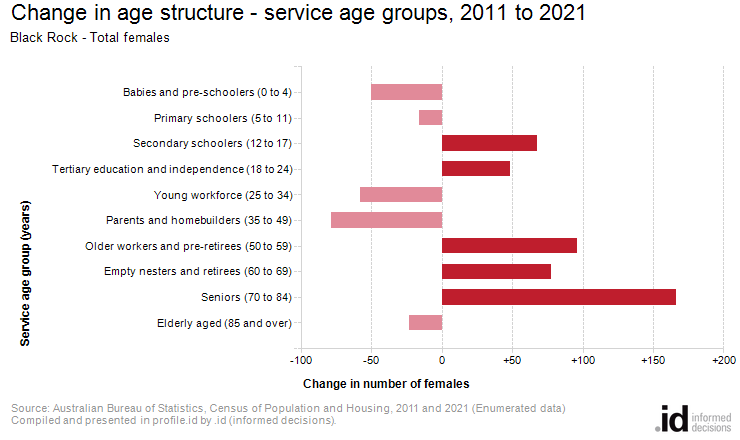
From 2011 to 2021, Black Rock's female population increased by 229 people (7.5%). This represents an average annual population change of 0.73% per year over the period.
The largest changes in the female age structure in this area between 2011 and 2021 were in the age groups:
- Seniors (70 to 84) (+166 females)
- Older workers and pre-retirees (50 to 59) (+96 females)
- Parents and homebuilders (35 to 49) (-78 females)
- Empty nesters and retirees (60 to 69) (+78 females)