City of Manningham
Age groups - Unpaid childcare
In 2021, 144 people aged [Parameter].[COIIDLabel] in City of Manningham provided unpaid care for children other than their own.
The role of unpaid childcare by age group is related to many factors. Generally parents between the age of 30 and 50 are the most likely to be caring for their own children, but this dataset can provide an insight into the role played by other family members, for example, grandparents and older siblings, in caring for children as well. The availability of affordable child care outside the home is also a factor. This dataset can shed some light on the level of child care provided both inside the household and to other households by people in different age categories, and how it differs between areas.
The role of unpaid child care is a complex one so this topic should be viewed in conjunction with several others, including Household Type, Employment, Household Income and Unpaid Care to an aged or disabled person.
Derived from the Census question:
'In the last two weeks did the person spend time looking after a child, without pay?', which specifically asks respondents to differentiate between caring for their own children and caring for others children.
Children aged [Parameter].[COIIDLabel]
| Unpaid childcare | ||||||||
|---|---|---|---|---|---|---|---|---|
| City of Manningham - [Parameter].[COIIDLabel] | 2021 | 2011 | Change | |||||
| Unpaid child care | Number | % | [Toggles].[BMACOIIDDisplayLabel] | Number | % | [Toggles].[BMACOIIDDisplayLabel] | 2011 to 2021 | |
| Provided unpaid child care (all) | 149 | 3.3 | 26.5 | 174 | 4.0 | 27.0 | -25 | 12001 |
| Cared for own child/ren | 5 | 0.1 | 20.9 | 21 | 0.5 | 19.7 | -16 | 12002 |
| Cared for other child/ren | 144 | 3.2 | 5.2 | 154 | 3.6 | 6.6 | -10 | 12003 |
| Cared for own child/ren and other child/ren | 0 | 0.0 | 0.5 | 0 | 0.0 | 0.8 | 0 | 12004 |
| No unpaid child care provided | 4,166 | 93.6 | 68.1 | 3,766 | 86.9 | 65.7 | +400 | 12005 |
| Not stated | 138 | 3.1 | 5.4 | 396 | 9.1 | 7.3 | -258 | 12006 |
| Total people | 4,453 | 100.0 | 100.0 | 4,336 | 100.0 | 100.0 | +117 | |
Source: Australian Bureau of Statistics, Census of Population and Housing (opens a new window) 2011 and 2021. Compiled and presented by .id (opens a new window)(informed decisions).
Compiled and presented in profile.id by .id (informed decisions).
Dominant groups
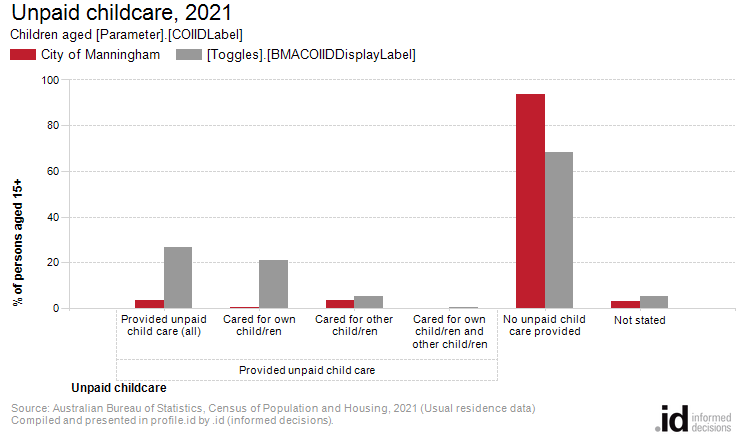
Analysis of the unpaid child care provided by people aged [Parameter].[COIIDLabel] in City of Manningham in 2021 compared to [Parameter].[BMACOIIDLabel] shows that there was a lower proportion of people who provided unpaid child care either to their own or to other children. Overall, 3.3% of the population aged [Parameter].[COIIDLabel] provided unpaid child care, compared with 26.5% for [Parameter].[BMACOIIDLabel].
The major differences between the share of people aged [Parameter].[COIIDLabel] providing unpaid child care in City of Manningham and [Parameter].[BMACOIIDLabel] were:
- A larger percentage who No unpaid child care provided (93.6% compared to 68.1%)
- A smaller percentage who Provided unpaid child care (all) (3.3% compared to 26.5%)
- A smaller percentage who Cared for own child/ren (0.1% compared to 20.9%)
- A smaller percentage who Not stated (3.1% compared to 5.4%)
Emerging groups
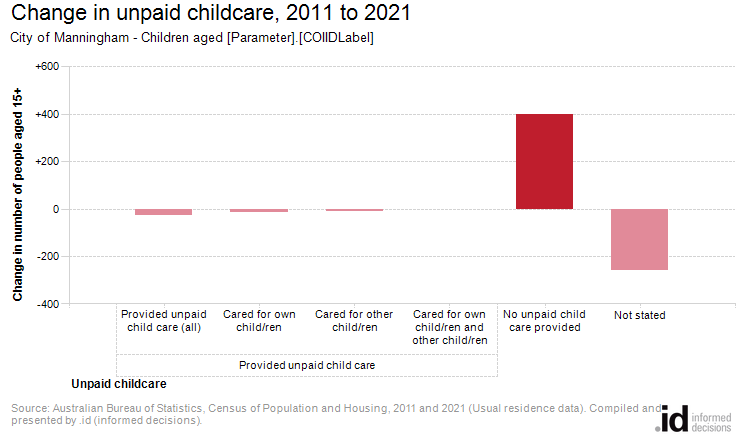
The number of people aged between [Parameter].[COIIDLabel] who provided unpaid child care for their own and/or other people's children in City of Manningham decreased by 25 between 2011 and 2021.
The largest changes in the number of people aged [Parameter].[COIIDLabel] performing unpaid child care in City of Manningham, between 2011 and 2021 were those who:
- No unpaid child care provided (+400 persons)
- Not stated (-258 persons)