Runaway Bay
Five year age groups
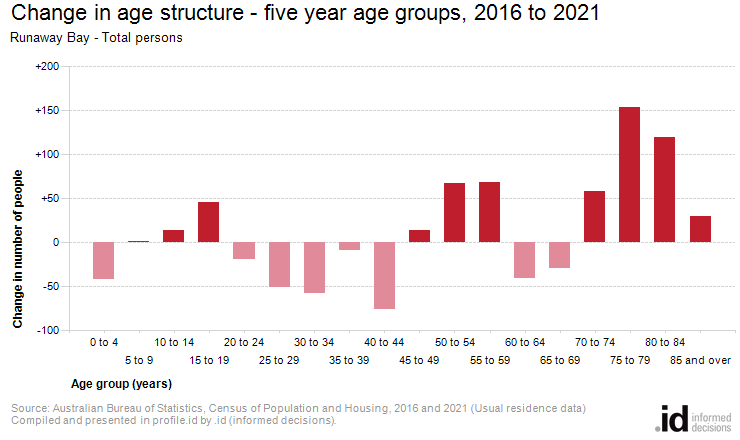
In 2021, the largest age group in Runaway Bay was 70 to 74 year olds. The group that changed the most since 2016 was 75 to 79 year olds, increasing by 154 people.
The Age Structure of Runaway Bay provides key insights into the level of demand for age based services and facilities such as child care. It is also an indicator of Runaway Bay's residential role and function and how it is likely to change in the future.
Five year age groups present a classic age profile of the population. Each age group covers exactly five years, which enables direct comparison between each group.
To get a more complete picture Runaway Bay's Age Structure should be viewed in conjunction with Household Types and Dwelling Types.
Derived from the Census question:
'What is the person's date of birth or age?'
Total population
| Age structure - Five year age groups | ||||||||
|---|---|---|---|---|---|---|---|---|
| Runaway Bay - Total persons (Usual residence) | 2021 | 2016 | Change | |||||
| Five year age groups (years) | Number | % | South East Queensland % | Number | % | South East Queensland % | 2016 to 2021 | |
| 0 to 4 | 294 | 3.2 | 5.7 | 336 | 3.7 | 6.3 | -42 | 2001 |
| 5 to 9 | 375 | 4.0 | 6.4 | 374 | 4.1 | 6.6 | +1 | 2002 |
| 10 to 14 | 413 | 4.4 | 6.6 | 400 | 4.4 | 6.2 | +13 | 2003 |
| 15 to 19 | 426 | 4.6 | 6.1 | 381 | 4.2 | 6.3 | +45 | 2004 |
| 20 to 24 | 385 | 4.1 | 6.6 | 404 | 4.5 | 7.1 | -19 | 2005 |
| 25 to 29 | 304 | 3.3 | 7.0 | 355 | 3.9 | 7.1 | -51 | 2006 |
| 30 to 34 | 354 | 3.8 | 7.2 | 412 | 4.5 | 7.2 | -58 | 2007 |
| 35 to 39 | 402 | 4.3 | 7.2 | 411 | 4.5 | 6.7 | -9 | 2008 |
| 40 to 44 | 467 | 5.0 | 6.7 | 544 | 6.0 | 7.0 | -77 | 2009 |
| 45 to 49 | 621 | 6.7 | 6.7 | 608 | 6.7 | 6.9 | +13 | 2010 |
| 50 to 54 | 701 | 7.5 | 6.4 | 634 | 7.0 | 6.4 | +67 | 2011 |
| 55 to 59 | 724 | 7.8 | 5.9 | 656 | 7.2 | 6.0 | +68 | 2012 |
| 60 to 64 | 696 | 7.5 | 5.4 | 737 | 8.1 | 5.3 | -41 | 2013 |
| 65 to 69 | 757 | 8.1 | 4.8 | 787 | 8.7 | 4.9 | -30 | 2014 |
| 70 to 74 | 789 | 8.5 | 4.4 | 731 | 8.1 | 3.7 | +58 | 2015 |
| 75 to 79 | 695 | 7.5 | 3.1 | 541 | 6.0 | 2.6 | +154 | 2016 |
| 80 to 84 | 486 | 5.2 | 2.0 | 366 | 4.0 | 1.7 | +120 | 2017 |
| 85 and over | 423 | 4.5 | 1.9 | 394 | 4.3 | 1.9 | +29 | 2018 |
| Total population | 9,312 | 100.0 | 100.0 | 9,071 | 100.0 | 100.0 | +241 | |
Source: Australian Bureau of Statistics, Census of Population and Housing (opens a new window) 2016 and 2021. Compiled and presented by .id (opens a new window)(informed decisions).
(Usual residence data)
Compiled and presented in profile.id by .id (informed decisions).
Compiled and presented in profile.id by .id (informed decisions).
Dominant groups
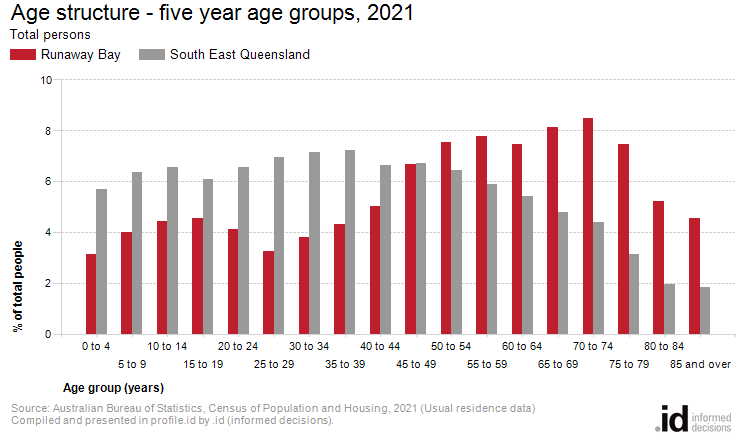
Analysis of the five year age groups of Runaway Bay in 2021 compared to South East Queensland shows that there was a lower proportion of people in the younger age groups (under 15) and a higher proportion of people in the older age groups (65+).
Overall, 11.6% of the population was aged between 0 and 15, and 33.8% were aged 65 years and over, compared with 18.6% and 16.2% respectively for South East Queensland.
The major differences between the age structure of Runaway Bay and South East Queensland were:
- A larger percentage of persons aged 75 to 79 (7.5% compared to 3.1%)
- A larger percentage of persons aged 70 to 74 (8.5% compared to 4.4%)
- A smaller percentage of persons aged 25 to 29 (3.3% compared to 7.0%)
- A smaller percentage of persons aged 30 to 34 (3.8% compared to 7.2%)
Emerging groups
From 2016 to 2021, Runaway Bay's population increased by 241 people (2.7%). This represents an average annual population change of 0.53% per year over the period.
The largest changes in age structure in this area between 2016 and 2021 were in the age groups:
- 75 to 79 (+154 persons)
- 80 to 84 (+120 persons)
- 40 to 44 (-77 persons)
- 55 to 59 (+68 persons)