Waverley Council area
Need for assistance
In 2021, 1,177 females (or 3.3% of the female population) in Waverley Council area reported needing help in their day-to-day lives due to disability. This was a similar percentage to 2006.
Waverley Council area's disability statistics relate directly to need for assistance due to a severe or profound disability. The information may be used in the planning of local facilities, services such as day-care and occasional care and in the provision of information and support to carers. Waverley Council area's disability statistics help in understanding the prevalence of people who need support in the community, and along with information on Unpaid Care to a person with a disability, how that support is provided.
Please note: A person's reported need for assistance is based on a subjective assessment and should therefore be treated with caution. See the specific data notes for further detail.
Derived from the Census questions:
'Does the person ever need someone to help with, or be with them for, self care activities?', 'Does the person ever need someone to help with, or be with them for, body movement activities?', 'Does the person ever need someone to help with, or be with them for, communication activities?', and 'What are the reasons for the need for assistance or supervision shown in questions 20, 21 and 22?' (as per above).
Total population
| Need for assistance with core activities by age | ||||||||
|---|---|---|---|---|---|---|---|---|
| Waverley Council area - Females (Usual residence) | 2021 | 2006 | Change | |||||
| Assistance needed by age group (years) | Number | % of total age group | Western Sydney (LGA) % | Number | % of total age group | Western Sydney (LGA) % | 2006 to 2021 | |
| 0 to 4 | 13 | 0.7 | 1.0 | 8001 | 11 | 0.6 | 0.7 | +2 |
| 5 to 9 | 26 | 1.5 | 2.4 | 8011 | 12 | 0.9 | 1.4 | +14 |
| 10 to 19 | 51 | 1.6 | 2.3 | 8021 | 19 | 0.8 | 1.1 | +32 |
| 20 to 59 | 207 | 0.9 | 2.8 | 8031 | 144 | 0.7 | 2.1 | +63 |
| 60 to 64 | 58 | 4.0 | 9.5 | 8041 | 33 | 2.7 | 6.6 | +25 |
| 65 to 69 | 42 | 3.6 | 12.8 | 8051 | 44 | 4.6 | 9.2 | -2 |
| 70 to 74 | 92 | 7.4 | 17.2 | 8061 | 63 | 7.1 | 14.2 | +29 |
| 75 to 79 | 114 | 12.8 | 25.8 | 8071 | 108 | 12.9 | 22.7 | +6 |
| 80 to 84 | 196 | 27.9 | 40.3 | 8081 | 237 | 25.4 | 36.2 | -41 |
| 85 and over | 372 | 43.2 | 57.0 | 8091 | 448 | 48.9 | 55.9 | -76 |
| Total persons needing assistance | 1,177 | 3.3 | 6.2 | 1,119 | 3.6 | 4.4 | +58 | |
The Greater Western Sydney Region comprises the following 13 LGA's: Blacktown (C), Blue Mountains (C), Camden (A), Campbelltown (C), Canterbury Bankstown (A), Cumberland (A), Fairfield (C), Hawkesbury (C), Liverpool (C), Parramatta (C), Penrith (C), The Hills Shire (A) and Wollondilly (A).
Source: Australian Bureau of Statistics, Census of Population and Housing (opens a new window) 2006 and 2021. Compiled and presented in profile.id by .id (opens a new window)(informed decisions).
| Need for assistance with core activities summary | ||||||||
|---|---|---|---|---|---|---|---|---|
| Waverley Council area - Total females (Usual residence) | 2021 | 2006 | Change | |||||
| Assistance needed by age group (years) | Number | % | Western Sydney (LGA) % | Number | % | Western Sydney (LGA) % | 2006 to 2021 | |
| Total persons needing assistance | 1,177 | 3.3 | 6.2 | 8101 | 1,119 | 3.6 | 4.4 | +58 |
| Total persons not needing assistance | 31,971 | 90.5 | 88.0 | 8102 | 25,156 | 81.7 | 89.6 | +6,815 |
| Not stated | 2,185 | 6.2 | 5.8 | 8103 | 4,502 | 14.6 | 6.1 | -2,317 |
| Total Population | 35,333 | 100.0 | 100.0 | 30,777 | 100.0 | 100.0 | +4,556 | |
The Greater Western Sydney Region comprises the following 13 LGA's: Blacktown (C), Blue Mountains (C), Camden (A), Campbelltown (C), Canterbury Bankstown (A), Cumberland (A), Fairfield (C), Hawkesbury (C), Liverpool (C), Parramatta (C), Penrith (C), The Hills Shire (A) and Wollondilly (A).
Source: Australian Bureau of Statistics, Census of Population and Housing (opens a new window) 2006 and 2021. Compiled and presented by .id (opens a new window)(informed decisions).
Compiled and presented in profile.id by .id (informed decisions).
Compiled and presented in profile.id by .id (informed decisions).
Dominant groups
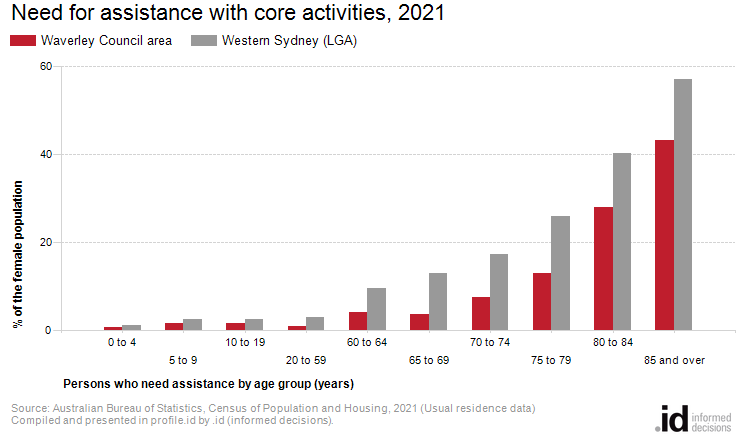
Analysis of the need for assistance of females in the Western Sydney (LGA) compared to Western Sydney (LGA) shows that there was a lower proportion of females who reported needing assistance with core activities.
Overall, 3.3% of the female population reported needing assistance with core activities, compared with 6.2% for Western Sydney (LGA).
The major differences in the female age groups reporting a need for assistance in Waverley Council area and Western Sydney (LGA) were:
- A smaller percentage of females aged 85 and over (43.2% compared to 57.0%)
- A smaller percentage of females aged 75 to 79 (12.8% compared to 25.8%)
- A smaller percentage of females aged 80 to 84 (27.9% compared to 40.3%)
- A smaller percentage of females aged 70 to 74 (7.4% compared to 17.2%)
Emerging groups
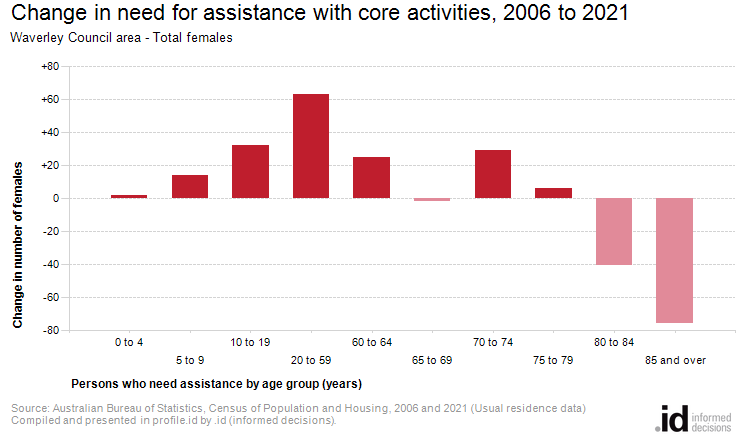
The major differences in the female age groups reporting a need for assistance between 2006 and 2021 in Waverley Council area were in the age groups:
- 85 and over (-76 females)
- 20 to 59 (+63 females)