Sutherland Shire
Aboriginal and Torres Strait Islander profile - Household size
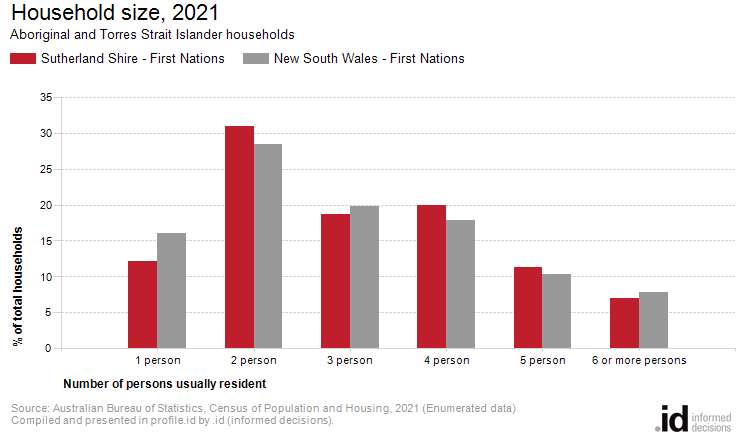
12% of Sutherland Shire's Aboriginal and Torres Strait Islander households contain only one person, compared with 16% of Aboriginal and Torres Strait Islander population households in New South Wales.
The size of households in general follows the life-cycle of families. Households are usually small at the stage of relationship formation (early marriage), and then increase in size with the advent of children. They later reduce in size again as these children reach adulthood and leave home.
Household size can also be influenced by a lack (or abundance) of affordable housing. First Nations persons often have a tradition of living with extended family members which significantly affects household size, and households can include multiple families.
Please note that this table counts First Nations households (households containing at least one Aboriginal or Torres Strait Islander usual resident) by the number of persons resident. The number of persons resident can include both Aboriginal and Torres Strait Islander people as well as other people - it represents the total number of people in the household.
For greater insight, First Nations household size data should be viewed in conjunction with Household Type, Age Structure and Household Income .
Derived from the three Census questions:
'Name of each person including visitors who spent the night of Tuesday, 10 August 2021 in this dwelling', and 'Where does the person usually live?', and 'Name of each person who usually lives in this dwelling but was away on Tuesday, 10 August 2021?'
Occupied private dwellings containing family, group and lone person households
| Household size | ||||||||
|---|---|---|---|---|---|---|---|---|
| Aboriginal and Torres Strait Islander households - Sutherland Shire | 2021 | 2016 | Change | |||||
| Number of persons usually resident | Number | % | New South Wales - First Nations % | Number | % | New South Wales - First Nations % | 2016 to 2021 | |
| 1 person | 208 | 12.1 | 16.0 | 169 | 13.6 | 13.9 | +39 | 20001 |
| 2 person | 531 | 30.9 | 28.4 | 329 | 26.4 | 27.2 | +202 | 20002 |
| 3 person | 321 | 18.7 | 19.8 | 275 | 22.1 | 20.2 | +46 | 20003 |
| 4 person | 342 | 19.9 | 17.8 | 288 | 23.2 | 19.0 | +54 | 20004 |
| 5 person | 195 | 11.4 | 10.3 | 110 | 8.8 | 10.8 | +85 | 20005 |
| 6 or more persons | 120 | 7.0 | 7.8 | 73 | 5.9 | 9.0 | +47 | 20006 |
| Total households | 1,717 | 100.0 | 100.0 | 1,244 | 100.0 | 100.0 | +473 | |
Source: Australian Bureau of Statistics, Census of Population and Housing (opens a new window) 2016 and 2021. Compiled and presented by .id (opens a new window)(informed decisions).
(Enumerated data)
Compiled and presented in profile.id by .id (informed decisions).
Compiled and presented in profile.id by .id (informed decisions).
Dominant groups
Analysis of the number of Aboriginal and Torres Strait Islander persons usually resident in a household in Sutherland Shire compared with Aboriginal and Torres Strait Islander population households in New South Wales shows that there were a lower proportion of lone person households, and a higher proportion of larger households (those with 4 persons or more). Overall there were 12.1142% of lone person households, and 38.2644% of larger households, compared with 16.0283% and 35.828% respectively for Aboriginal and Torres Strait Islander population households in New South Wales.
The major differences between household size for Aboriginal and Torres Strait Islander households of Sutherland Shire and Aboriginal and Torres Strait Islander population households of New South Wales were:
- A larger percentage of households with 2 person usually resident (30.9% compared to 28.4%)
- A larger percentage of households with 4 person usually resident (19.9% compared to 17.8%)
- A larger percentage of households with 5 person usually resident (11.4% compared to 10.3%)
- A smaller percentage of households with 1 person usually resident (12.1% compared to 16.0%)
Emerging groups
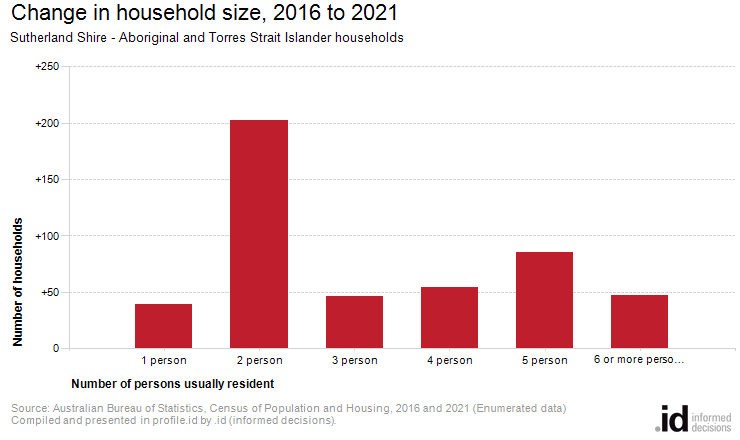
The number of Aboriginal and Torres Strait Islander households in Sutherland Shire increased by 473 between 2016 and 2021.
The largest changes in the number of persons usually resident in a household in Sutherland Shire between 2016 and 2021 were:
- 2 person households (+202 households)
- 5 person households (+85 households)
- 4 person households (+54 households)