Rockhampton
Overseas born - Five year age groups
In 2021, there were 8,182 people [Toggles].[COIIDDisplayLabel] living in Rockhampton, with largest age group being 35 to 39 year olds in 2021.
The Age Structure of the overseas born population in Rockhampton provides key insights into the level of demand for age based services and facilities such as child care and language services. Overseas-born populations may have a quite different age profile to the general population, depending on when the main groups migrated. For instance in a student area they are likely to be younger, however an area which received a lot of post-war migration may have an older population.
Five year age groups present a classic age profile of the population. Each age group covers exactly five years, which enables direct comparison between each group.
To get a more complete picture Rockhampton's overseas-born Age Structure should be viewed in conjunction with Household Types and Dwelling Types.
Derived from the Census question:
'What is the person's date of birth or age?'
People [Toggles].[COIIDDisplayLabel]
| Five year age groups | ||||||||
|---|---|---|---|---|---|---|---|---|
| Rockhampton - [Toggles].[COIIDDisplayLabel] | 2021 | 2011 | Change | |||||
| Five year age groups (years) | Number | % | Regional QLD | Number | % | Regional QLD | 2011 to 2021 | |
| 0 to 4 | 74 | 0.9 | 5.4 | 127 | 1.9 | 6.8 | -53 | 2001 |
| 5 to 9 | 182 | 2.2 | 6.2 | 256 | 3.8 | 6.7 | -74 | 2002 |
| 10 to 14 | 320 | 3.9 | 6.7 | 310 | 4.6 | 6.9 | +10 | 2003 |
| 15 to 19 | 411 | 5.0 | 6.0 | 275 | 4.1 | 6.7 | +136 | 2004 |
| 20 to 24 | 397 | 4.9 | 5.7 | 345 | 5.2 | 6.0 | +52 | 2005 |
| 25 to 29 | 614 | 7.5 | 6.2 | 591 | 8.8 | 6.3 | +23 | 2006 |
| 30 to 34 | 792 | 9.7 | 6.3 | 663 | 9.9 | 6.1 | +129 | 2007 |
| 35 to 39 | 892 | 10.9 | 6.4 | 634 | 9.5 | 6.8 | +258 | 2008 |
| 40 to 44 | 757 | 9.3 | 6.1 | 621 | 9.3 | 7.1 | +136 | 2009 |
| 45 to 49 | 749 | 9.2 | 6.5 | 568 | 8.5 | 7.1 | +181 | 2010 |
| 50 to 54 | 601 | 7.3 | 6.6 | 538 | 8.0 | 6.9 | +63 | 2011 |
| 55 to 59 | 556 | 6.8 | 6.6 | 453 | 6.8 | 6.2 | +103 | 2012 |
| 60 to 64 | 499 | 6.1 | 6.4 | 450 | 6.7 | 6.0 | +49 | 2013 |
| 65 to 69 | 410 | 5.0 | 5.7 | 317 | 4.7 | 4.7 | +93 | 2014 |
| 70 to 74 | 374 | 4.6 | 5.2 | 220 | 3.3 | 3.5 | +154 | 2015 |
| 75 to 79 | 265 | 3.2 | 3.7 | 156 | 2.3 | 2.5 | +109 | 2016 |
| 80 to 84 | 169 | 2.1 | 2.3 | 107 | 1.6 | 1.9 | +62 | 2017 |
| 85 and over | 120 | 1.5 | 2.1 | 67 | 1.0 | 1.7 | +53 | 2018 |
| Total people | 8,182 | 100.0 | 100.0 | 6,698 | 100.0 | 100.0 | +1,484 | |
Source: Australian Bureau of Statistics, Census of Population and Housing (opens a new window) 2011 and 2021. Compiled and presented by .id (opens a new window)(informed decisions).
Compiled and presented in profile.id by .id (informed decisions).
Compiled and presented in profile.id by .id (informed decisions).
Dominant groups
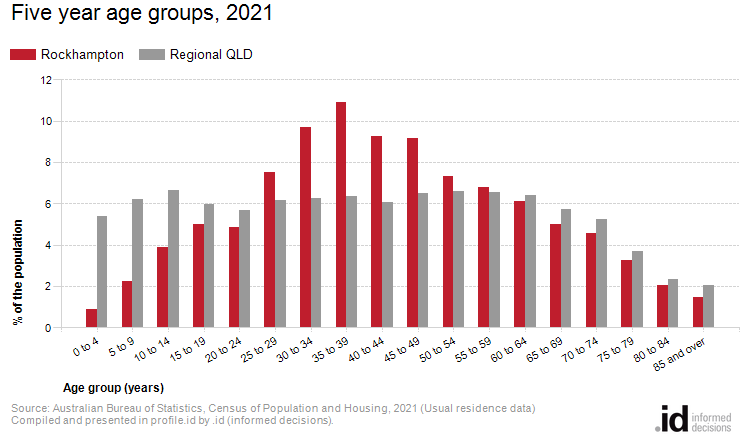
Analysis of the five year age groups of the population [Toggles].[COIIDDisplayLabel] in Rockhampton in 2021 compared to Regional QLD shows that there was a lower proportion of people in the younger age groups (under 15) as well as a lower proportion of people in the older age groups (65+).
Overall, 7.0% of the population [Toggles].[COIIDDisplayLabel] was aged between 0 and 14, and 16.4% were aged 65 years and over, compared with 18.3% and 19.1% respectively for Regional QLD.
The major differences between the age structure of the population [Toggles].[COIIDDisplayLabel] in Rockhampton and Regional QLD were:
- A larger percentage of people aged 35 to 39 (10.9% compared to 6.4%)
- A larger percentage of people aged 30 to 34 (9.7% compared to 6.3%)
- A smaller percentage of people aged 0 to 4 (0.9% compared to 5.4%)
- A smaller percentage of people aged 5 to 9 (2.2% compared to 6.2%)
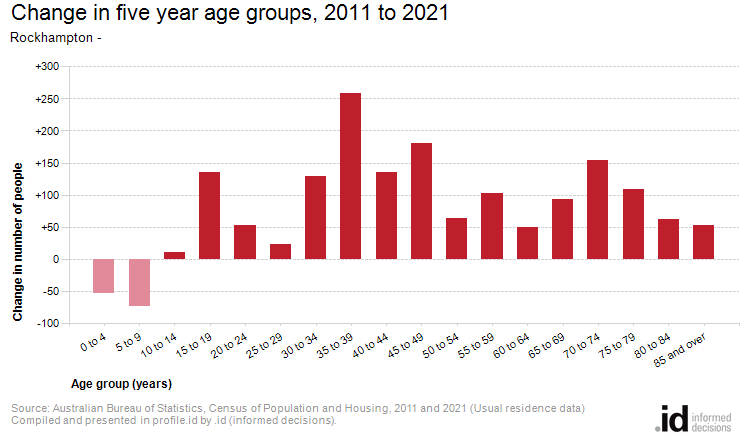
Emerging groups
The largest changes in age structure of the population [Toggles].[COIIDDisplayLabel] in this area between 2011 and 2021 were in the age groups:
- 35 to 39 (+258 persons)
- 45 to 49 (+181 persons)
- 70 to 74 (+154 persons)
- 15 to 19 (+136 persons)