City of Parramatta
Age groups - Household type
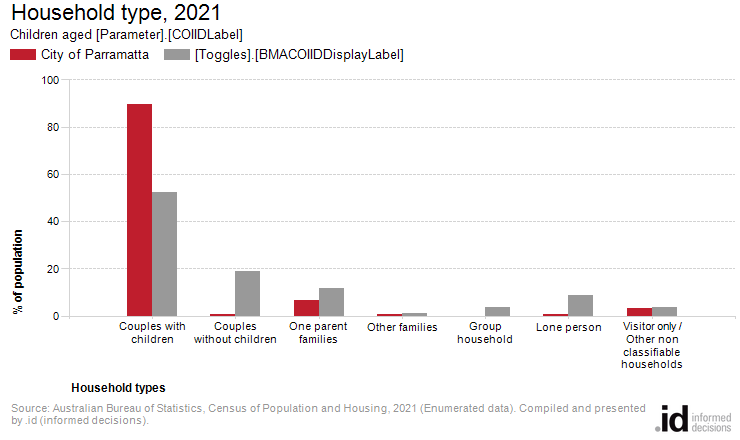
In the City of Parramatta, 89.6% of children aged [Parameter].[COIIDLabel] were in couples with children households.
The City of Parramatta's household and family structure is one of the most important demographic indicators.
People form different types of households at different stages in life, so this varies enormously by age group in all areas. This topic is useful, however, in comparing the types of households formed by each age group relative to the benchmark. For instance, in some areas, children may mostly live in couple families, while in others they are mainly in one-parent families. Are elderly parents still living with their extended family or do they have empty nester households?
To continue building the story, the City of Parramatta's Household Types should be viewed in conjunction with Dwelling Type.
Derived from the Census question:
'What is the person's relationship (to each other person in the household)?'
Children aged [Parameter].[COIIDLabel], counted in private dwellings
| Household type | ||||||||
|---|---|---|---|---|---|---|---|---|
| City of Parramatta - [Parameter].[COIIDLabel] | 2021 | 2011 | Change | |||||
| Households by type | Number | % | [Toggles].[BMACOIIDDisplayLabel] | Number | % | [Toggles].[BMACOIIDDisplayLabel] | 2011 to 2021 | |
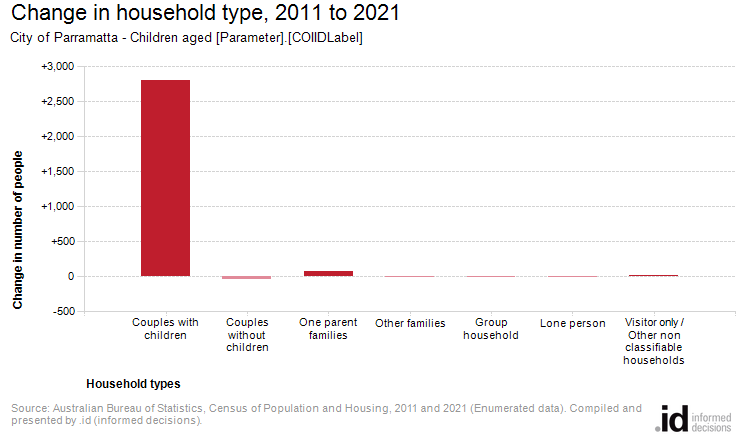
| Couples with children | 14,302 | 89.6 | 52.4 | 11,502 | 87.6 | 52.6 | +2,800 | 19500 |
| Couples without children | 44 | 0.3 | 18.8 | 80 | 0.6 | 17.9 | -36 | 19501 |
| One parent families | 1,050 | 6.6 | 11.5 | 974 | 7.4 | 12.0 | +76 | 19502 |
| Other families | 3 | 0.0 | 1.1 | 7 | 0.1 | 1.3 | -4 | 19503 |
| Group household | 0 | 0.0 | 3.7 | 6 | 0.0 | 3.5 | -6 | 19504 |
| Lone person | 27 | 0.2 | 8.7 | 35 | 0.3 | 8.5 | -8 | 19505 |
| Visitor only / Other non classifiable households | 544 | 3.4 | 3.8 | 527 | 4.0 | 4.2 | +17 | 19507 |
| Total people in private dwellings | 15,970 | 100.0 | 100.0 | 13,131 | 100.0 | 100.0 | +2,839 | |
Source: Australian Bureau of Statistics, Census of Population and Housing (opens a new window) 2011 and 2021. Compiled and presented by .id (opens a new window)(informed decisions).
Dominant groups
Analysis of the household/family types of children aged [Parameter].[COIIDLabel] in the City of Parramatta in 2021 compared to [Parameter].[BMACOIIDLabel], shows that there was a higher proportion of children aged [Parameter].[COIIDLabel] in couple families with child(ren) as well as a lower proportion in one-parent families. Overall, 89.6% of children aged [Parameter].[COIIDLabel] were in couple families with child(ren), and 6.6% were in one-parent families, compared with 52.4% and 11.5% respectively for [Parameter].[BMACOIIDLabel].
There was a lower proportion of children aged [Parameter].[COIIDLabel] in lone person households and a lower proportion in couples without children. Overall, the proportion of children aged [Parameter].[COIIDLabel] in lone person households was 0.2% compared to 8.7% in [Parameter].[BMACOIIDLabel] while the proportion of couples without children was 0.3% compared to 18.8% in [Parameter].[BMACOIIDLabel].
Emerging groups
The number of children aged [Parameter].[COIIDLabel] in households in City of Parramatta increased by 2,839 between 2011 and 2021.
The largest changes in family/household types for children aged [Parameter].[COIIDLabel] in the City of Parramatta between 2011 and 2021 were:
- Couples with children (+2,800 persons)
- One parent families (+76 persons)