Northern Beaches Council area
Recent arrivals - Language spoken at home
In 2016, 55.0% of recent overseas arrivals in 2016, spoke a language other than English at home.
The Northern Beaches Council area's language statistics show the proportion of the population who speak a language at home other than English. For recent arrivals, this is a good indicator of translation services which might be required, as recent arrivals may be less likely to have good English skills. They represent the languages which have increased in prevalence in just the last few years in the Northern Beaches Council area compared to [Parameter].[BMACOIIDLabel].
The Northern Beaches Council area's language statistics should be analysed in conjunction with Country of Birth and Proficiency in English to assist in identifying specific cultural and ethnic groups in the area and the services required by the multicultural community.
Derived from the Census question:
'Does the person use a language other than English at home?'
People born overseas and arriving in Australia between 2016 and 10 Aug 2021
| Language spoken at home - Ranked by size | |||||||
|---|---|---|---|---|---|---|---|
| Northern Beaches Council area - Recent arrivals | 2016 | ||||||
| Language | Number | % | [Toggles].[BMACOIIDDisplayLabel] | ||||
| Portuguese | 1,293 | 10.6 | 0.5 | 30196 | |||
| Spanish | 907 | 7.4 | 1.2 | 30227 | |||
| Nepali | 642 | 5.3 | 1.2 | 30162 | |||
| Mandarin | 423 | 3.5 | 5.0 | 30144 | |||
| French | 357 | 2.9 | 0.4 | 30070 | |||
| Tibetan | 317 | 2.6 | 0.0 | 30241 | |||
| German | 305 | 2.5 | 0.3 | 30077 | |||
| Dutch | 175 | 1.4 | 0.1 | 30056 | |||
| Italian | 168 | 1.4 | 1.0 | 30108 | |||
| Punjabi | 159 | 1.3 | 0.8 | 30198 | |||
| Hindi | 153 | 1.3 | 1.5 | 30088 | |||
| Tagalog | 151 | 1.2 | 0.9 | 30232 | |||
| Afrikaans | 129 | 1.1 | 0.1 | 30005 | |||
| Filipino | 113 | 0.9 | 0.5 | 30066 | |||
| Russian | 106 | 0.9 | 0.4 | 30203 | |||
| Cantonese | 93 | 0.8 | 2.8 | 30035 | |||
| Japanese | 86 | 0.7 | 0.3 | 30109 | |||
| Thai | 86 | 0.7 | 0.4 | 30239 | |||
| Vietnamese | 86 | 0.7 | 2.2 | 30260 | |||
| Swedish | 81 | 0.7 | 0.1 | 30230 | |||
| Polish | 72 | 0.6 | 0.2 | 30195 | |||
| Persian (excluding Dari) | 60 | 0.5 | 0.5 | 30192 | |||
| Korean | 59 | 0.5 | 1.1 | 30121 | |||
| Indonesian | 59 | 0.5 | 0.6 | 30103 | |||
| Czech | 56 | 0.5 | 0.1 | 30047 | |||
| Malayalam | 41 | 0.3 | 0.3 | 30141 | |||
| Arabic | 39 | 0.3 | 4.2 | 30011 | |||
| Urdu | 32 | 0.3 | 0.8 | 30257 | |||
| Turkish | 28 | 0.2 | 0.4 | 30253 | |||
| Finnish | 28 | 0.2 | 0.0 | 30067 | |||
| Hungarian | 26 | 0.2 | 0.1 | 30092 | |||
| Slovak | 26 | 0.2 | 0.0 | 30216 | |||
| Bengali | 24 | 0.2 | 0.7 | 30026 | |||
| Armenian | 22 | 0.2 | 0.2 | 30012 | |||
| Hebrew | 20 | 0.2 | 0.1 | 30087 | |||
| Lithuanian | 19 | 0.2 | 0.0 | 30132 | |||
| Danish | 18 | 0.1 | 0.0 | 30050 | |||
| Tamil | 17 | 0.1 | 0.7 | 30235 | |||
| Fijian | 16 | 0.1 | 0.1 | 30064 | |||
| Norwegian | 16 | 0.1 | 0.0 | 30167 | |||
| Serbian | 16 | 0.1 | 0.4 | 30207 | |||
| Māori (New Zealand) | 13 | 0.1 | 0.0 | 30148 | |||
| Tongan | 11 | 0.1 | 0.2 | 30247 | |||
| Slovene | 10 | 0.1 | 0.0 | 30217 | |||
| Romanian | 10 | 0.1 | 0.0 | 30200 | |||
| Croatian | 10 | 0.1 | 0.3 | 30045 | |||
| Show me more! | |||||||
Source: Australian Bureau of Statistics, Census of Population and Housing (opens a new window) 2016 (Usual residence data). Compiled and presented in profile.id by .id (opens a new window)(informed decisions).
Excludes languages with fewer than 10 people speaking them at home.
| Language spoken at home - Summary | |||||||
|---|---|---|---|---|---|---|---|
| Northern Beaches Council area - Recent arrivals | 2016 | ||||||
| Language summary | Number | % | [Toggles].[BMACOIIDDisplayLabel] | ||||
| Speaks English only | 5,360 | 43.8 | 57.2 | 60500 | |||
| Non-English total | 6,727 | 55.0 | 37.4 | 60510 | |||
| Not stated | 140 | 1.1 | 5.4 | 60520 | |||
| Total people | 12,227 | 100.0 | 100.0 | ||||
Source: Australian Bureau of Statistics, Census of Population and Housing (opens a new window) 2016 (Usual residence data). Compiled and presented in profile.id by .id (opens a new window)(informed decisions).
Compiled and presented in profile.id by .id (informed decisions).
Dominant groups
Analysis of the language spoken at home by recent overseas arrivals in the Northern Beaches Council area in 2016 compared to [Parameter].[BMACOIIDLabel] shows that there was a smaller proportion of people who spoke English only, and a larger proportion of those speaking a non-English language (either exclusively, or in addition to English).
Overall, 43.8% of recent overseas arrivals spoke English only, and 55.0% spoke a non-English language, compared with 57.2% and 37.4% respectively for [Parameter].[BMACOIIDLabel].
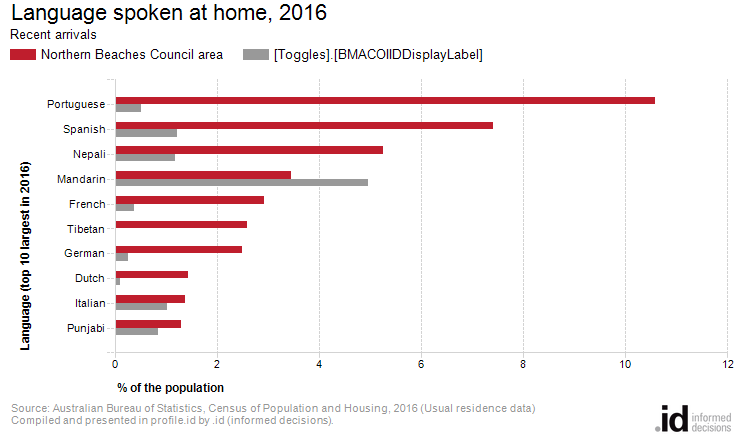
The dominant language spoken at home by recent overseas arrivals, other than English, in the Northern Beaches Council area was Portuguese, with 10.6% of the population, or 1,293 people speaking this language at home.
The major differences between the languages spoken at home for the recent overseas arriving population of the Northern Beaches Council area and [Parameter].[BMACOIIDLabel] in 2016 were:
- A larger percentage speaking Portuguese at home (10.6% compared to 0.5%)
- A larger percentage speaking Spanish at home (7.4% compared to 1.2%)
- A larger percentage speaking Nepali at home (5.3% compared to 1.2%)
- A smaller percentage speaking Arabic at home (0.3% compared to 4.2%)