Kingsbury
Equivalised household income
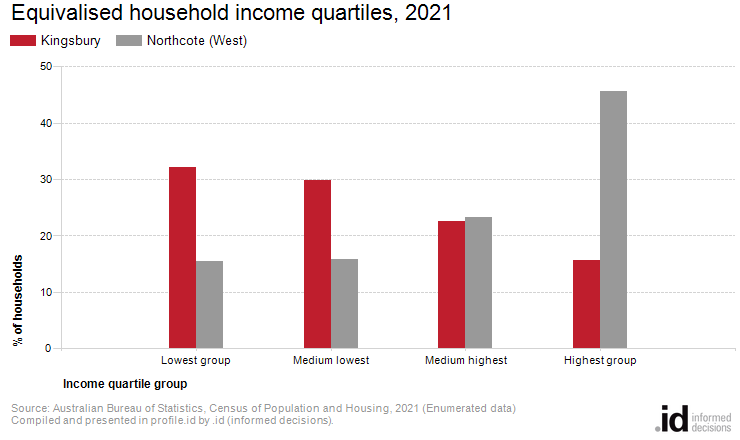
Assuming all households were the same size, the 'lowest' quartile was the largest income group in Kingsbury in 2021.
While Household Income is a useful measure, it is difficult to tell if changes over time and between geographic areas are due to actual changes in income levels, or due to changes in household size and composition. For example, an increase in lower income households could be due to job losses in key economic sectors, or simply due to decreasing household size as adult children leave home.
Equivalised Household Income puts all households on an equal footing independent of household size and composition to enable a true comparison between areas and over time. It is an indicator of the income resource available to a household of standard size and is the best measure of the changing economic fortunes of households living in Kingsbury.
A detailed explanation of how Equivalised Household Income quartiles are calculated and interpreted is available in specific data notes.
Learn more about the characteristics of low-income households here.
Derived from the Census question:
'What is the total of all wages/salaries, government benefits, pensions, allowances and other income the person usually receives?'
Family, group and lone person households with stated income
| Equivalised household income quartiles | ||||||||
|---|---|---|---|---|---|---|---|---|
| Kingsbury - Households (Enumerated) | 2021 | 2016 | Change | |||||
| Quartile group | Number | % | Northcote (West) % | Number | % | Northcote (West) % | 2016 to 2021 | |
| Lowest group | 406 | 32.1 | 15.4 | 405 | 35.3 | 17.5 | +1 | 32001 |
| Medium lowest | 377 | 29.8 | 15.8 | 362 | 31.5 | 16.3 | +15 | 32002 |
| Medium highest | 285 | 22.6 | 23.2 | 242 | 21.1 | 21.9 | +43 | 32003 |
| Highest group | 197 | 15.6 | 45.6 | 137 | 12.0 | 44.3 | +60 | 32004 |
| Total Households | 1,268 | 100.0 | 100.0 | 1,148 | 100.0 | 100.0 | +119 | |
Source: Australian Bureau of Statistics, Census of Population and Housing (opens a new window) 2016 and 2021. Compiled and presented by .id (opens a new window)(informed decisions).
(Enumerated data)
| Equivalised household income - Quartile group dollar ranges | |||||
|---|---|---|---|---|---|
| Calculated from income data for [theQBMQuartile] | Weekly income by Census year | ||||
| Equivalised household income ranges | 2021 | 2016 | 2011 | 2006 | 2001 |
| Lowest group | $0 to $602 | $0 to $494 | $0 to $430 | $0 to $352 | $0 to $288 |
| Medium lowest | $603 to $1,074 | $495 to $864 | $431 to $751 | $353 to $601 | $289 to $492 |
| Medium highest | $1,075 to $1,708 | $865 to $1,392 | $752 to $1,203 | $602 to $969 | $493 to $782 |
| Highest group | $1,709 and over | $1,393 and over | $1,204 and over | $970 and over | $783 and over |
Compiled and presented in profile.id by .id (informed decisions).
Compiled and presented in profile.id by .id (informed decisions).
Dominant groups
Equivalised income quartiles allow us to compare relative income-earning capabilities across time. Because the data is equivalised, households of different size and composition are placed on an equal footing.
Analysis of the distribution of households by income quartile in Kingsbury compared to Northcote (West) shows that there was a lesser proportion of households in the highest equivalised income quartile, and a greater proportion in the lowest equivalised income quartile.
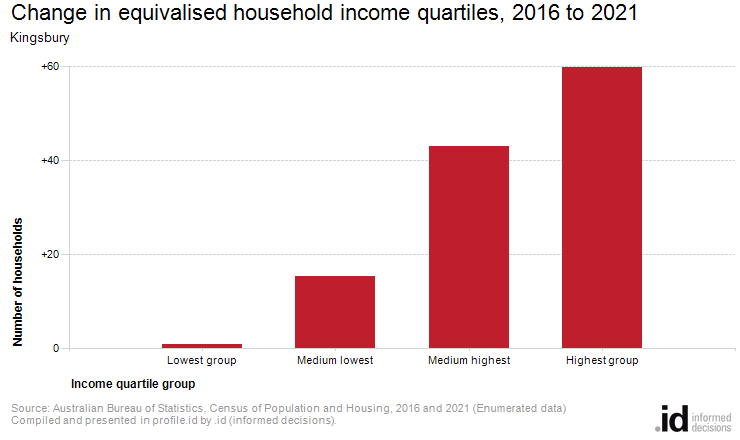
Emerging groups
The most significant change in Kingsbury between 2016 and 2021 was in the highest quartile which showed an increase of 60 households.