Clarence Valley Council area
Households without children
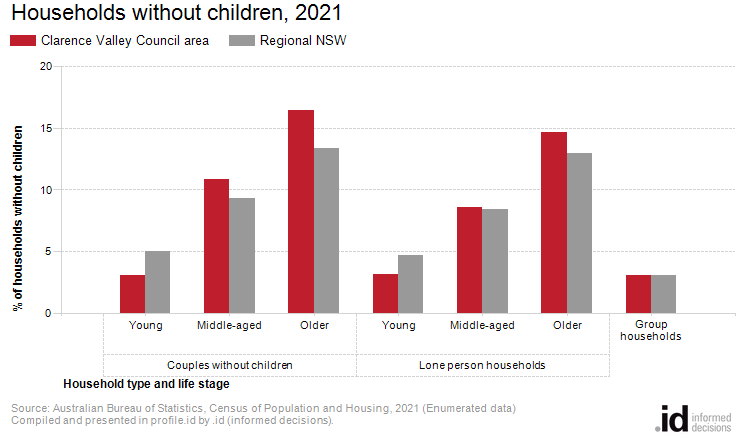
In Clarence Valley Council area, older couples without children account for 16% of total households in 2021.
Households without Children include couples without children and lone person households. They require different services depending on the age of the people in the households. For example young couples who have not had children (yet) compared to older "empty nester" couples whose children may have left home.
For Households without Children in Clarence Valley Council area, life stage is based on the age of the household reference person (usually person 1 on the Census form):
- Young: Aged 15-44
- Middle-aged: Aged 45-64
- Older: Aged 65 and over
To continue building the story, Clarence Valley Council area's Household data should be viewed in conjunction with Household Size, Age Structure and Dwelling Type.
Derived from the Census question:
'What is the person's relationship (to each other person in the household)?'
Households
| Households without children by life stage | ||||||||
|---|---|---|---|---|---|---|---|---|
| Clarence Valley Council area - Households (Enumerated) | 2021 | 2016 | Change | |||||
| Households without children | Number | % | Regional NSW % | Number | % | Regional NSW % | 2016 to 2021 | |
| 6,948 | 30.4 | 27.7 | 6,403 | 29.4 | 27.0 | +545 | 19001 | |
| 708 | 3.1 | 5.0 | 559 | 2.6 | 4.5 | +149 | 19002 | |
| Middle-aged couples without children | 2,485 | 10.9 | 9.3 | 2,514 | 11.6 | 10.0 | -29 | 19003 |
| 3,755 | 16.4 | 13.3 | 3,330 | 15.3 | 12.5 | +425 | 19004 | |
| 6,047 | 26.5 | 26.1 | 5,736 | 26.4 | 25.5 | +311 | 19005 | |
| 725 | 3.2 | 4.7 | 647 | 3.0 | 4.7 | +78 | 19006 | |
| Middle-aged lone persons | 1,969 | 8.6 | 8.4 | 2,148 | 9.9 | 8.9 | -179 | 19007 |
| 3,353 | 14.7 | 13.0 | 2,941 | 13.5 | 12.0 | +412 | 19008 | |
| 693 | 3.0 | 3.1 | 617 | 2.8 | 3.1 | +76 | 19009 | |
| Total households without children | 13,688 | 59.9 | 56.8 | 12,756 | 58.6 | 55.6 | +932 | 19010 |
| Total households | 22,855 | 100.0 | 100.0 | 21,765 | 100.0 | 100.0 | +1,090 | |
Source: Australian Bureau of Statistics, Census of Population and Housing (opens a new window) 2016 and 2021. Compiled and presented by .id (opens a new window)(informed decisions).
(Enumerated data)
Compiled and presented in profile.id by .id (informed decisions).
Compiled and presented in profile.id by .id (informed decisions).
Dominant groups
Analysis of the households without children in Clarence Valley Council area in 2021 compared to Regional NSW shows that there was a smaller proportion of young couples without children, a larger proportion of middle-aged couples without children, and a larger proportion of older couples without children.
In addition, there were a smaller proportion of young lone person households, a similar proportion of middle-aged lone person households, and a larger proportion of older lone person households.
Emerging groups
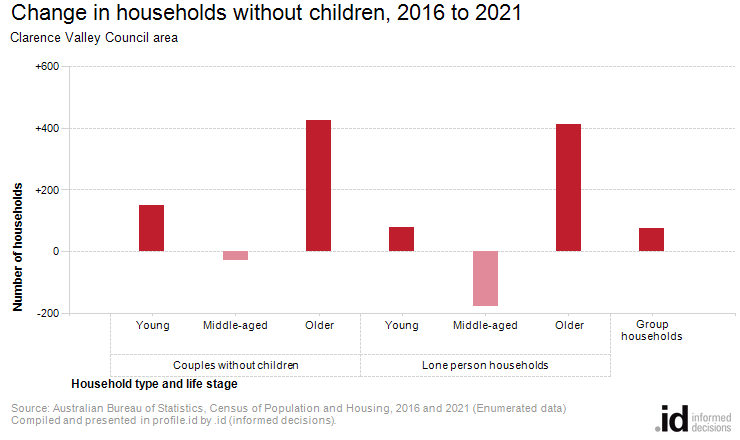
Between 2016 and 2021, the number of households without children increased by 932.
The largest changes in households without children in Clarence Valley Council area, between 2016 and 2021 were:
- Older couples without children (+425 persons)
- Older lone persons (+412 persons)
- Middle-aged lone persons (-179 persons)
- Young couples without children (+149 persons)