Campbelltown City
Need for assistance - Household income
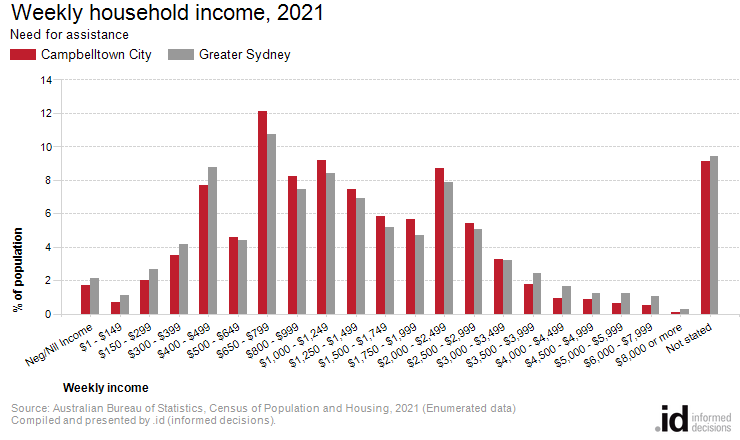
In Campbelltown City, 13.4777% of people reporting a need for assistance were in households earning an income of $2,500 or more per week.
Households form the common 'economic unit' in our society. Campbelltown City's Household Income is one of the most important indicators of socio-economic status. For people with a disability or need for assistance, household income is an important indicator of the level of ability to participate in Australian society and economy. It is closely tied to employment status and occupation and should be viewed in conjunction with those topics.
Please note that any persons in a household who need assistance will be counted at this topic. There may be other household members who do not require assistance.
The incomes presented on this page are for the latest Census year only. For comparison of incomes over time, go to Household Income Quartiles.
Derived from the Census question:
'What is the total of all wages/salaries, government benefits, pensions, allowances and other income the person usually receives?'
People with a need for assistance, counted in private dwellings
| Weekly household income | |||||||
|---|---|---|---|---|---|---|---|
| Campbelltown City - Need for assistance | 2021 | ||||||
| Weekly income | Number | % | Greater Sydney | ||||
| Neg/Nil Income | 152 | 1.7 | 2.1 | 28001 | |||
| $1 - $149 | 60 | 0.7 | 1.1 | 28002 | |||
| $150 - $299 | 180 | 2.0 | 2.7 | 28003 | |||
| $300 - $399 | 309 | 3.5 | 4.1 | 28004 | |||
| $400 - $499 | 681 | 7.7 | 8.8 | 28005 | |||
| $500 - $649 | 406 | 4.6 | 4.4 | 28006 | |||
| $650 - $799 | 1,075 | 12.1 | 10.7 | 28007 | |||
| $800 - $999 | 732 | 8.2 | 7.4 | 28009 | |||
| $1,000 - $1,249 | 817 | 9.2 | 8.4 | 28010 | |||
| $1,250 - $1,499 | 663 | 7.5 | 6.9 | 28011 | |||
| $1,500 - $1,749 | 516 | 5.8 | 5.2 | 28012 | |||
| $1,750 - $1,999 | 502 | 5.7 | 4.7 | 28013 | |||
| $2,000 - $2,499 | 773 | 8.7 | 7.9 | 28014 | |||
| $2,500 - $2,999 | 483 | 5.4 | 5.1 | 28015 | |||
| $3,000 - $3,499 | 287 | 3.2 | 3.2 | 28016 | |||
| $3,500 - $3,999 | 159 | 1.8 | 2.5 | 28017 | |||
| $4,000 - $4,499 | 83 | 0.9 | 1.6 | 28018 | |||
| $4,500 - $4,999 | 76 | 0.9 | 1.2 | 28019 | |||
| $5,000 - $5,999 | 56 | 0.6 | 1.2 | 28020 | |||
| $6,000 - $7,999 | 44 | 0.5 | 1.0 | 28021 | |||
| $8,000 or more | 8 | 0.1 | 0.3 | 28022 | |||
| Not stated | 812 | 9.2 | 9.5 | 28098 | |||
| Total people counted in private dwellings | 8,874 | 100.0 | 100.0 | ||||
Source: Australian Bureau of Statistics, Census of Population and Housing (opens a new window) 2021 (Enumerated data). Compiled and presented in profile.id by .id (opens a new window) (informed decisions).
Compiled and presented by .id (informed decisions).
Dominant groups
Analysis of household income levels for people reporting a need for assistance in Campbelltown City in 2021 compared to Greater Sydney shows that there was a smaller proportion of people with a need for assistance in high income households (those earning $2,500 per week or more) and a lower proportion in low income households (those earning less than $650 per week).
Overall, 13.4777% of people reporting a need for assistance were in households who earned a high income, and 20.1488% were in low income households, compared with 16.1128% and 23.2008% respectively for Greater Sydney.
The major differences between the incomes for households with people reporting a need for assistance in Campbelltown City and Greater Sydney were:
- A larger percentage of people in households who earned $650 - $799 (12.1% compared to 10.7%)
- A larger percentage of people in households who earned $1,750 - $1,999 (5.7% compared to 4.7%)
- A larger percentage of people in households who earned $2,000 - $2,499 (8.7% compared to 7.9%)
- A smaller percentage of people in households who earned $400 - $499 (7.7% compared to 8.8%)