Caboolture Planning Area
Qualifications
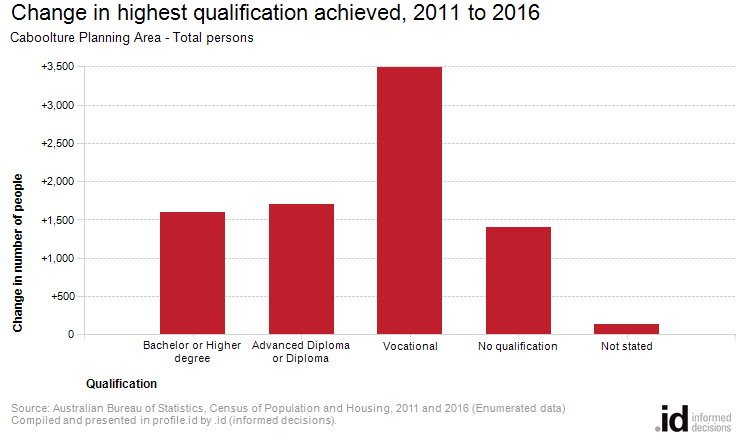
26.2% of people in Caboolture Planning Area had a Vocational qualification in 2016, higher than North Lakes. This represents an increase of 3,497 people since 2011.
Educational Qualifications relate to education outside of primary and secondary school and are one of the most important indicators of socio-economic status. With other data sources, such as Employment Status, Income and Occupation, Caboolture Planning Area's Educational Qualifications help to evaluate the economic opportunities and socio-economic status of the area and identify skill gaps in the labour market.
Derived from the Census question:
'What is the level of the highest qualification the person has completed?'
Persons aged 15 years and over
| Highest qualification achieved | ||||||||
|---|---|---|---|---|---|---|---|---|
| Caboolture Planning Area - Persons aged 15+ (Enumerated) | 2016 | 2011 | Change | |||||
| Qualification level | Number | % | North Lakes % | Number | % | North Lakes % | 2011 to 2016 | |
| Bachelor or Higher degree | 4,800 | 8.3 | 21.1 | 5001 | 3,197 | 6.4 | 19.1 | +1,603 |
| Advanced Diploma or Diploma | 4,798 | 8.3 | 12.0 | 5002 | 3,094 | 6.2 | 11.6 | +1,704 |
| Vocational | 15,211 | 26.2 | 22.6 | 5003 | 11,715 | 23.6 | 21.9 | +3,497 |
| 27,146 | 46.8 | 37.6 | 5004 | 25,741 | 51.9 | 41.4 | +1,405 | |
| Not stated | 6,006 | 10.4 | 6.7 | 5005 | 5,873 | 11.8 | 6.1 | +133 |
| Total persons aged 15+ | 57,963 | 100.0 | 100.0 | 49,621 | 100.0 | 100.0 | +8,343 | |
Source: Australian Bureau of Statistics, Census of Population and Housing (opens a new window) 2011 and 2016. Compiled and presented by .id (opens a new window)(informed decisions).
(Enumerated data)
Compiled and presented in profile.id by .id (informed decisions).
Compiled and presented in profile.id by .id (informed decisions).
Dominant groups
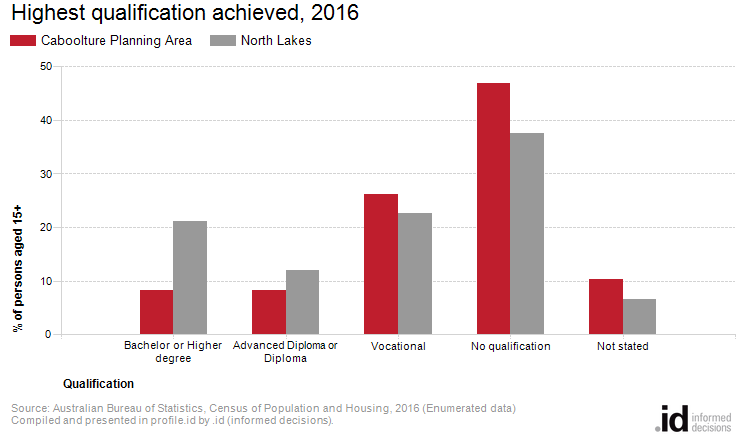
Analysis of the qualifications of the population in Caboolture Planning Area in 2016 compared to North Lakes shows that there was a lower proportion of people holding formal qualifications (Bachelor or higher degree; Advanced Diploma or Diploma; or Vocational qualifications), and a higher proportion of people with no formal qualifications.
Overall, 42.8% of the population aged 15 and over held educational qualifications, and 46.8% had no qualifications, compared with 55.7% and 37.6% respectively for North Lakes.
The major differences between qualifications held by the population of Caboolture Planning Area and North Lakes were:
- A larger percentage of persons with No qualifications (46.8% compared to 37.6%)
- A larger percentage of persons with Vocational qualifications (26.2% compared to 22.6%)
- A smaller percentage of persons with Bachelor or Higher degrees (8.3% compared to 21.1%)
- A smaller percentage of persons with Advanced Diploma or Diplomas (8.3% compared to 12.0%)
Emerging groups
The largest changes in the qualifications of the population in Caboolture Planning Area between 2011 and 2016 were in those with:
- Vocational qualifications (+3,497 persons)
- Advanced Diploma or Diplomas (+1,704 persons)
- Bachelor or Higher degrees (+1,603 persons)
- No qualifications (+1,405 persons)