Hawkesbury City
Population highlights
|
Estimated Resident Population
Hawkesbury City 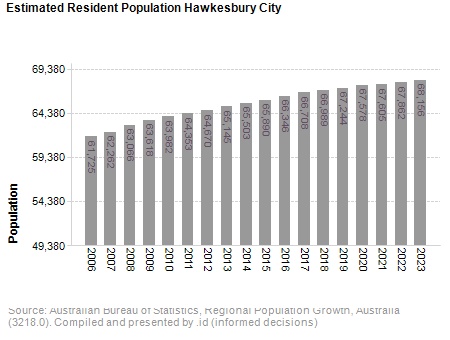
Source: Australian Bureau of Statistics, Regional Population Growth, Australia (3218.0). Compiled and presented by .id (informed decisions)
|
||
Hawkesbury City
Hawkesbury City 2021
Greater Sydney 37
New South Wales 39
Australia 38
Greater Sydney 2%
New South Wales 3%
Australia 3%
Greater Sydney 34%
New South Wales 31%
Australia 30%
Greater Sydney 9%
New South Wales 10%
Australia 10%
Greater Sydney 22%
New South Wales 24%
Australia 24%
Greater Sydney 46%
New South Wales 35%
Australia 28%
Greater Sydney $2,099
New South Wales $1,849
Australia $1,740
Greater Sydney $560
New South Wales $500
Australia $432
Greater Sydney $470
New South Wales $420
Australia $380
Greater Sydney 35%
New South Wales 31%
Australia 30%
Greater Sydney 32%
New South Wales 31%
Australia 33%
Greater Sydney 39%
New South Wales 29%
Australia 28%
Greater Sydney 37%
New South Wales 27%
Australia 22%
Greater Sydney 6%
New South Wales 5%
Australia 5%
Greater Sydney 33%
New South Wales 28%
Australia 26%
Greater Sydney 15%
New South Wales 18%
Australia 19%
Greater Sydney 5.1%
New South Wales 4.9%
Australia 5.1%
Greater Sydney 60%
New South Wales 59%
Australia 61%
Greater Sydney 39%
New South Wales 31%
Australia 21%
Greater Sydney 1,010
New South Wales 1,000
Australia 1,001