Regional NT
Housing rental quartiles
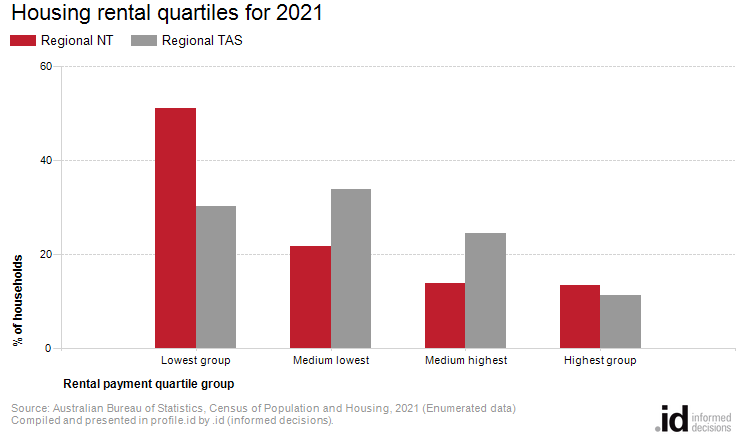
In Regional NT, the 'lowest group' was the largest quartile, comprising 51% of renting households in 2021.
Rental payments in Regional NT are indicative of its residential role and function and are directly related to the value of residential property. When viewed with Household Income data they may also indicate the level of 'housing stress' in the community.
The quartile method is the most objective method of comparing change in the rental costs of a community over time.
A detailed explanation of how Housing Rental Payment quartiles are calculated and interpreted is available in specific data notes.
Derived from the Census questions:
'How much does your household pay for this dwelling?' and 'Is this dwelling (owned outright, owned with a mortgage etc.)'
Households renting their dwelling
| Housing rental quartiles | ||||||||
|---|---|---|---|---|---|---|---|---|
| Regional NT - Households (Enumerated) | 2021 | 2006 | Change | |||||
| Quartile group | Number | % | Regional TAS % | Number | % | Regional TAS % | 2006 to 2021 | |
| Lowest group | 6,452 | 51.1 | 30.3 | 6,526 | 52.8 | 33.1 | -74 | 33001 |
| Medium lowest | 2,736 | 21.7 | 33.9 | 2,803 | 22.7 | 26.1 | -67 | 33002 |
| Medium highest | 1,736 | 13.8 | 24.4 | 1,731 | 14.0 | 24.9 | +5 | 33003 |
| Highest group | 1,692 | 13.4 | 11.3 | 1,299 | 10.5 | 15.8 | +392 | 33004 |
| Total households with stated rent | 12,618 | 100.0 | 100.0 | 12,360 | 100.0 | 100.0 | +257 | |
Source: Australian Bureau of Statistics, Census of Population and Housing (opens a new window) 2006 and 2021. Compiled and presented by .id (opens a new window)(informed decisions).
(Enumerated data)
| Housing rental - Quartile group dollar ranges | |||||
|---|---|---|---|---|---|
| Calculated from rental payment data for [theQBMQuartile] | Weekly housing rental payments by Census year | ||||
| Rental payment ranges | 2021 | 2016 | 2011 | 2006 | 2001 |
| Lowest group | $0 to $282 | $0 to $248 | $0 to $197 | $0 to $138 | $0 to $104 |
| Medium lowest | $283 to $380 | $249 to $345 | $198 to $296 | $139 to $200 | $105 to $154 |
| Medium highest | $381 to $485 | $346 to $446 | $297 to $386 | $201 to $269 | $155 to $210 |
| Highest group | $486 and over | $447 and over | $387 and over | $270 and over | $211 and over |
Compiled and presented in profile.id by .id (informed decisions).
Compiled and presented in profile.id by .id (informed decisions).
Dominant groups
Rental payment quartiles allow us to compare relative rental liabilities across time. Analysis of the distribution of households by rental payment quartiles in Regional NT compared to Regional TAS shows that there was a larger proportion of households in the highest payment quartile, as well as a larger proportion in the lowest payment quartile.
Emerging groups
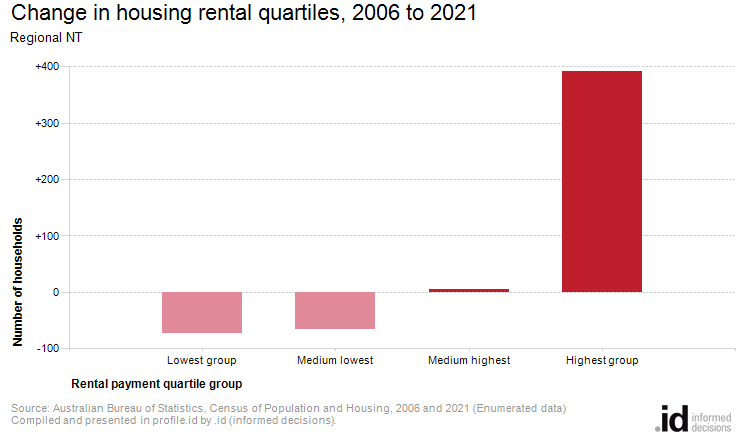
The total number of households renting their dwelling in Regional NT increased by 258 between 2006 and 2021. The most significant change during this period was in the highest quartile which showed an increase of 392 households.