City of Stonnington
Overseas born - Education institution attending
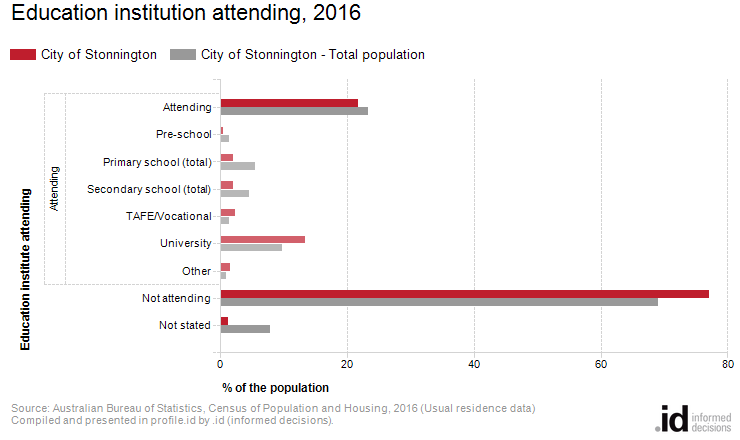
In 2016, 21.8% of the [Toggles].[COIIDDisplayLabel] in the City of Stonnington attended an educational institution.
The share of the City of Stonnington's overseas-born population attending educational institutions reflects the age structure of the population, the year of migration and the reason for migration. Areas with an older migrant population are likely to have low rates of educational attendance, though there may be some among second and third generations within the community.
Some areas attract a lot of overseas students, and these areas could be expected to have very high rates of educational attendance, particularly for universities.
To complete this story, the City of Stonnington's educational attendance information needs to be viewed in conjunction with the Age Structure and Qualification topics.
Please note: In many areas of Australia, at the 2021 Census, numbers of overseas-born university students declined substantially due to university face-to-face closures during the COVID pandemic. This may have changed since the Census, please use with caution.
Derived from the Census question:
'What type of educational institution is the person attending?'
People [Toggles].[COIIDDisplayLabel]
| Education institution attending | ||||||||
|---|---|---|---|---|---|---|---|---|
| City of Stonnington - [Toggles].[COIIDDisplayLabel] | 2016 | 2011 | Change | |||||
| Type of institution | Number | % | City of Stonnington - Total population | Number | % | City of Stonnington - Total population | 2011 to 2016 | |
| Attending | 7,126 | 21.8 | 23.2 | 7000 | 5,111 | 18.6 | 22.6 | +2,015 |
| Pre-school | 153 | 0.5 | 1.3 | 7001 | 116 | 0.4 | 1.5 | +37 |
| Primary school | 659 | 2.0 | 5.4 | 7002 | 576 | 2.1 | 5.6 | +83 |
| Secondary school | 641 | 2.0 | 4.4 | 7006 | 484 | 1.8 | 4.4 | +157 |
| TAFE/Vocational | 778 | 2.4 | 1.4 | 7010 | 644 | 2.3 | 1.6 | +134 |
| University | 4,387 | 13.4 | 9.8 | 7011 | 2,938 | 10.7 | 8.6 | +1,449 |
| Other | 508 | 1.6 | 0.9 | 7012 | 353 | 1.3 | 0.8 | +155 |
| Not attending | 25,209 | 77.0 | 69.0 | 7013 | 21,737 | 79.3 | 69.8 | +3,472 |
| Not stated | 390 | 1.2 | 7.8 | 7014 | 576 | 2.1 | 7.6 | -186 |
| Total people | 32,725 | 100.0 | 100.0 | 27,424 | 100.0 | 100.0 | +5,301 | |
Source: Australian Bureau of Statistics, Census of Population and Housing (opens a new window) 2011 and 2016. Compiled and presented by .id (opens a new window)(informed decisions).
Compiled and presented in profile.id by .id (informed decisions).

Compiled and presented in profile.id by .id (informed decisions).
Dominant groups
Analysis of the share of the population [Toggles].[COIIDDisplayLabel] attending educational institutions in the City of Stonnington in 2016 compared to the total population shows that there was a lower proportion attending primary school, a lower proportion attending secondary school, and a higher proportion engaged in tertiary level education.
Overall, 2.0% of the population [Toggles].[COIIDDisplayLabel] were attending primary school, 2.0% were attending secondary institutions, and 15.8% were learning at a tertiary level, compared with 5.4%, 4.4% and 11.2% respectively for the total population.
The major differences between the share of the population [Toggles].[COIIDDisplayLabel] attending learning institutions in the City of Stonnington and the total population were:
- A larger percentage of people Not attending (77.0% compared to 69.0%)
- A larger percentage of people University (13.4% compared to 9.8%)
- A smaller percentage of people Not stated (1.2% compared to 7.8%)
- A smaller percentage of people attending primary school (2.0% compared to 5.4%)
Emerging groups
From 2011 to 2016, the population [Toggles].[COIIDDisplayLabel] in the City of Stonnington increased by 12617 people (46.0071470245041%). This represents an average annual change of 3.6% per year over the period.
The largest changes in the number of people[Toggles].[COIIDDisplayLabel] attending education institutions in the City of Stonnington, between 2011 and 2016 were:
- Not attending (+3,472 persons)
- University (+1,449 persons)
- Not stated (-186 persons)
- Secondary school (+157 persons)