City of Whittlesea
Non-English speakers - Five year age groups
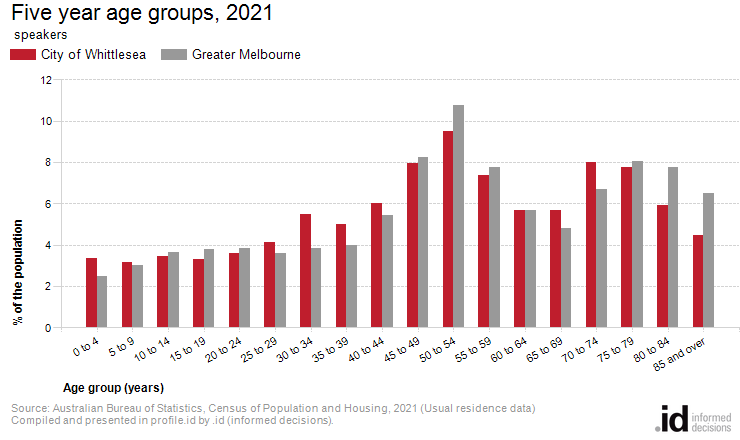
In 2021, there were 7,232 [Toggles].[COIIDDisplayLabel] speakers living in the City of Whittlesea, with largest age group being 50 to 54 year olds.
The Age Structure of the non-English speaking population in the City of Whittlesea provides key insights into the level of demand for age based services and facilities such as child care, and language services. Non-English speaking populations may have a quite different age profile to the general population, for instance in a student area, they are likely to be younger, however an area which received a lot of post-war migration may have an older non-English speaking population, and perhaps many second-generation speakers.
Five year age groups present a classic age profile of the population. Each age group covers exactly five years, which enables direct comparison between each group.
To get a more complete picture of the City of Whittlesea's non-English speaking Age Structure should be viewed in conjunction with Household Types and Dwelling Types.
Derived from the Census question:
'What is the person's date of birth or age?'
People using [COIIDLabelForLanguage] at home
| Five year age groups | ||||||||
|---|---|---|---|---|---|---|---|---|
| City of Whittlesea - [Toggles].[COIIDDisplayLabel] speakers | 2021 | 2011 | Change | |||||
| Five year age groups (years) | Number | % | Greater Melbourne | Number | % | Greater Melbourne | 2011 to 2021 | |
| 0 to 4 | 244 | 3.4 | 2.5 | 213 | 2.9 | 3.5 | +31 | 2001 |
| 5 to 9 | 229 | 3.2 | 3.0 | 282 | 3.9 | 4.4 | -53 | 2002 |
| 10 to 14 | 250 | 3.5 | 3.7 | 254 | 3.5 | 4.1 | -4 | 2003 |
| 15 to 19 | 240 | 3.3 | 3.8 | 296 | 4.1 | 3.7 | -56 | 2004 |
| 20 to 24 | 261 | 3.6 | 3.8 | 302 | 4.2 | 3.7 | -41 | 2005 |
| 25 to 29 | 299 | 4.1 | 3.6 | 403 | 5.6 | 3.7 | -104 | 2006 |
| 30 to 34 | 396 | 5.5 | 3.9 | 439 | 6.1 | 5.3 | -43 | 2007 |
| 35 to 39 | 362 | 5.0 | 4.0 | 618 | 8.5 | 8.2 | -256 | 2008 |
| 40 to 44 | 435 | 6.0 | 5.4 | 658 | 9.1 | 10.9 | -223 | 2009 |
| 45 to 49 | 576 | 8.0 | 8.2 | 486 | 6.7 | 7.9 | +90 | 2010 |
| 50 to 54 | 687 | 9.5 | 10.8 | 426 | 5.9 | 5.7 | +261 | 2011 |
| 55 to 59 | 535 | 7.4 | 7.8 | 404 | 5.6 | 4.7 | +131 | 2012 |
| 60 to 64 | 412 | 5.7 | 5.7 | 603 | 8.3 | 6.3 | -191 | 2013 |
| 65 to 69 | 410 | 5.7 | 4.8 | 640 | 8.8 | 7.8 | -230 | 2014 |
| 70 to 74 | 578 | 8.0 | 6.7 | 533 | 7.4 | 8.1 | +45 | 2015 |
| 75 to 79 | 563 | 7.8 | 8.1 | 401 | 5.5 | 6.5 | +162 | 2016 |
| 80 to 84 | 430 | 5.9 | 7.8 | 193 | 2.7 | 3.8 | +237 | 2017 |
| 85 and over | 325 | 4.5 | 6.5 | 100 | 1.4 | 1.8 | +225 | 2018 |
| Total people | 7,232 | 100.0 | 100.0 | 7,251 | 100.0 | 100.0 | -19 | |
Source: Australian Bureau of Statistics, Census of Population and Housing (opens a new window) 2011 and 2021. Compiled and presented by .id (opens a new window)(informed decisions).
Compiled and presented in profile.id by .id (informed decisions).
Compiled and presented in profile.id by .id (informed decisions).
Dominant groups
Analysis of the [Toggles].[COIIDDisplayLabel] speaking population in the City of Whittlesea in 2021 compared to Greater Melbourne shows that there was a higher proportion of people in the younger age groups (under 15) and a lower proportion of people in the older age groups (65+).
Overall, 10.0% of the [Toggles].[COIIDDisplayLabel] speaking population was aged between 0 and 14, and 31.9% were aged 65 years and over, compared with 9.2% and 33.8% respectively for Greater Melbourne.
The major differences between the age groups of the [Toggles].[COIIDDisplayLabel] speaking population in the City of Whittlesea and Greater Melbourne were:
- A larger percentage of people aged 30 to 34 (5.5% compared to 3.9%)
- A larger percentage of people aged 70 to 74 (8.0% compared to 6.7%)
- A smaller percentage of people aged 85 and over (4.5% compared to 6.5%)
- A smaller percentage of people aged 80 to 84 (5.9% compared to 7.8%)
Emerging groups
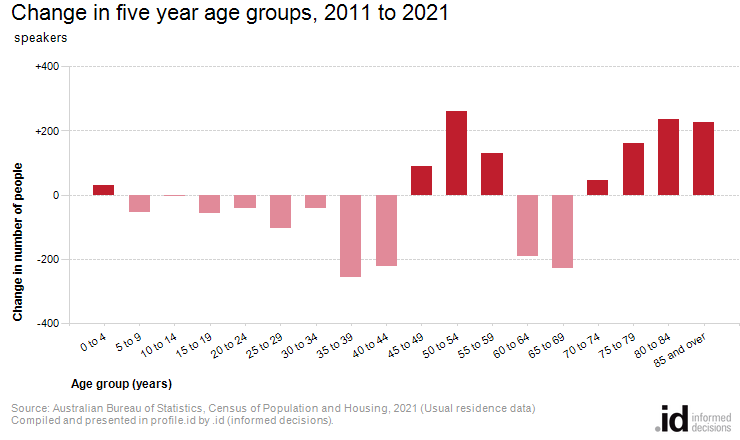
From 2011 to 2021, City of Whittlesea's [Toggles].[COIIDDisplayLabel] speaking population decreased by 19 people (0.3%). This represents an average annual population change of -0.03% per year over the period.
The largest changes in the age groups of the [Toggles].[COIIDDisplayLabel] speaking population in this area between 2011 and 2021 were in the age groups:
- 50 to 54 (+261 persons)
- 35 to 39 (-256 persons)
- 80 to 84 (+237 persons)
- 65 to 69 (-230 persons)