City of Whittlesea
Age groups - Dwelling type
In the City of Whittlesea 9.9% of children aged 0 to 4 years were in medium or high density dwellings.
Dwelling Type is an important determinant of the City of Whittlesea's residential role and function. People occupy different dwelling structures at different life stages, so not only can dwelling type give the overall role and function of the area, it can show the role it plays for different age groups.
For instance, an area may have minimal high density housing stock, but that which there is, is mainly occupied by students aged 18-24. On the other hand, medium density may be an important housing stock for the elderly to downsize into - but are they taking this up? Are families living increasingly in high density housing while retired populations occupy separate houses?
Derived from the Census:
'Dwelling Structure is derived from the ABS address register supplemented with information from Census Field Officers.'
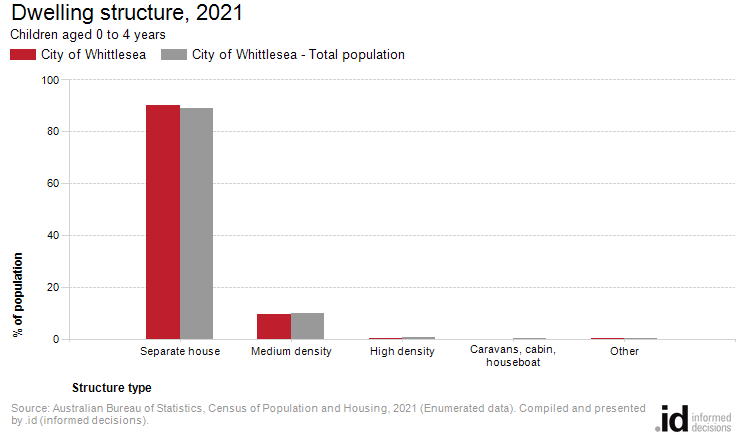
Children aged 0 to 4 years, counted in dwellings
| Dwelling structure | ||||||||
|---|---|---|---|---|---|---|---|---|
| City of Whittlesea - 0 to 4 years | 2021 | 2011 | Change | |||||
| Dwelling type | Number | % | City of Whittlesea - Total population | Number | % | City of Whittlesea - Total population | 2011 to 2021 | |
| Separate house | 14,848 | 90.0 | 89.1 | 10,337 | 90.1 | 91.4 | +4,511 | 27001 |
| Medium density | 1,574 | 9.5 | 10.1 | 1,102 | 9.6 | 8.3 | +472 | 27002 |
| High density | 65 | 0.4 | 0.7 | 18 | 0.2 | 0.2 | +47 | 27003 |
| Caravans, cabin, houseboat | 0 | 0.0 | 0.0 | 0 | 0.0 | 0.0 | 0 | 27004 |
| Other | 4 | 0.0 | 0.0 | 7 | 0.1 | 0.1 | -3 | 27005 |
| Not stated | 6 | 0.0 | 0.0 | 3 | 0.0 | 0.0 | +3 | 27006 |
| Total people counted in occupied private dwellings | 16,497 | 100.0 | 100.0 | 11,467 | 100.0 | 100.0 | +5,030 | |
Source: Australian Bureau of Statistics, Census of Population and Housing (opens a new window) 2011 and 2021. Compiled and presented by .id (opens a new window)(informed decisions).
| Dwelling type | ||||||||
|---|---|---|---|---|---|---|---|---|
| City of Whittlesea - 0 to 4 years | 2021 | 2011 | Change | |||||
| Dwelling type | Number | % | City of Whittlesea - Total population | Number | % | City of Whittlesea - Total population | 2011 to 2021 | |
| Occupied private dwellings | 16,497 | 99.8 | 98.9 | 11,467 | 99.7 | 99.0 | +5,030 | 27500 |
| Non private dwellings | 36 | 0.2 | 1.1 | 32 | 0.3 | 1.0 | +4 | 27502 |
| Total people counted in occupied dwellings | 16,533 | 100.0 | 100.0 | 11,499 | 100.0 | 100.0 | +5,034 | |
Source: Australian Bureau of Statistics, Census of Population and Housing (opens a new window) 2011 and 2021. Compiled and presented by .id (opens a new window)(informed decisions).

Dominant groups
Analysis of the types of dwellings for children aged 0 to 4 years in the City of Whittlesea in 2021 shows that 90.0% of children aged 0 to 4 years were living in separate houses; 9.5% were in medium density dwellings, and 0.4% were were in high density dwellings, compared with 89.1%, 10.1%, and 0.7% in the the total population respectively.
Emerging groups
The total number of children aged 0 to 4 years in occupied private dwellings in the City of Whittlesea increased by 5,030 between 2011 and 2021.
The largest changes in the type of dwellings for children aged 0 to 4 years in the City of Whittlesea between 2011 and 2021 were:
- Separate house (+4,511 persons)
- Medium density (+472 persons)