City of Townsville
Overseas born - Year of arrivals
In 2021, 27,079 people who were living in the City of Townsville, were [Toggles].[COIIDDisplayLabel] and 16.4% arrived in Australia within the last 5 years prior to 2021.
The Year of Arrival data records when the overseas born population arrived in Australia. The data shows the degree to which areas are 'ports' for new overseas arrivals and reveals the role of the City of Townsville in housing newer or older migrant groups.
Year of Arrival data should be looked at in conjunction with Age Structure - most people migrate to another country when they are relatively young.
Please note, for this topic only, where 'Total population' is selected as a benchmark, this refers to the total overseas-born population in the area. People not born overseas do not have a year of arrival.
Derived from the Census question:
'In what year did the person first arrive in Australia to live here for one year or more?'
People [Toggles].[COIIDDisplayLabel]
| Year of arrivals | ||||
|---|---|---|---|---|
| City of Townsville - [Toggles].[COIIDDisplayLabel] | 2021 | |||
| Year of arrival in Australia | Number | % | Regional QLD | |
| Arrived in 1960 or earlier | 1,384 | 5.1 | 5.7 | 100 |
| 1961 to 1970 | 2,392 | 8.8 | 8.5 | 110 |
| 1971 to 1980 | 2,281 | 8.4 | 9.1 | 120 |
| 1981 to 1990 | 2,950 | 10.9 | 11.3 | 130 |
| 1991 to 2000 | 2,614 | 9.7 | 10.7 | 140 |
| 2001 to 2010 | 6,557 | 24.2 | 22.7 | 150 |
| 2011 to 2015 | 3,755 | 13.9 | 13.2 | 160 |
| 2016 to Aug 2021 | 4,436 | 16.4 | 16.0 | 170 |
| Not stated | 710 | 2.6 | 2.9 | 415 |
| Total people | 27,079 | 100.0 | 100.0 | |
Source: Australian Bureau of Statistics, Census of Population and Housing (opens a new window) 2021 (Usual residence data). Compiled and presented in profile.id by .id (opens a new window)(informed decisions).
Compiled and presented in profile.id by .id (informed decisions).
Dominant groups
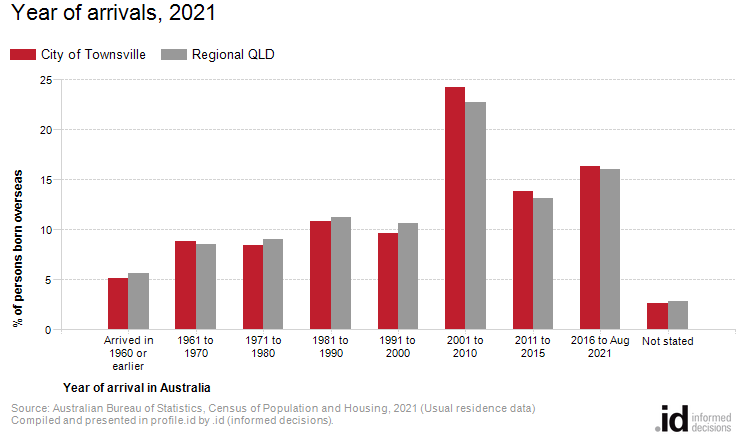
Analysis of the year of arrival for the population [Toggles].[COIIDDisplayLabel] of the City of Townsville in 2021 compared to Regional QLD shows that there was a smaller proportion of people who arrived before 2001, and a similar proportion of recent overseas arrivals (those who arrived between 2016 to 10 Aug 2021).
Overall, 42.9% of the population [Toggles].[COIIDDisplayLabel] arrived before 2001, and 16.4% arrived during or after 2016, compared with 45.2% and 16.0% respectively for Regional QLD.
The major differences between the year of arrival data the population [Toggles].[COIIDDisplayLabel] in the City of Townsville and Regional QLD were:
- A larger percentage of arrivals between 2001 to 2010 (24.2% compared to 22.7%)
- A smaller percentage of arrivals between 1991 to 2000 (9.7% compared to 10.7%)