City of Sydney
Overseas born - Occupation of employment
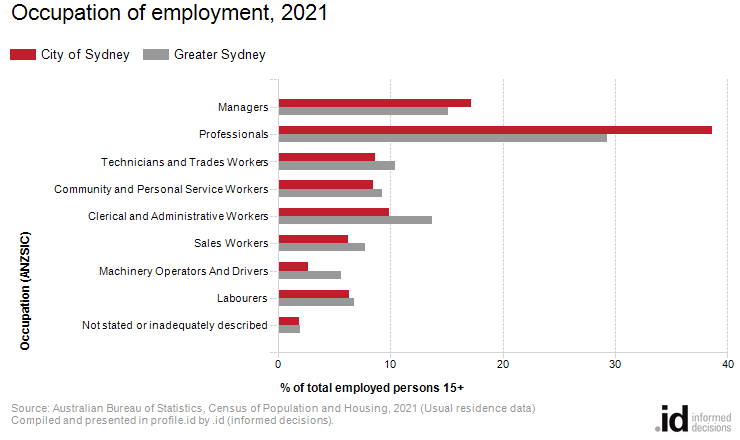
In 2021, there were more people [Toggles].[COIIDDisplayLabel] working as professionals in the City of Sydney than any other occupation.
The City of Sydney's occupation statistics quantify the occupations in which people born overseas (who are residents of the City of Sydney) work. The work destination may be in the local area or elsewhere.
The type of work done by migrant communities is influenced by their Age Stucture, Qualifications and migration stream. Many of Australia's recent migrants are skilled arrivals who fill identified skill gaps in particular occupation groups. Some older overseas-born communities may be retired, or otherwise not in the workforce. Only those who are employed are included in this topic.
Derived from the two Census questions:
'In the main job held last week, what was the person's occupation?' and 'What are the main tasks that the person himself/herself usually performs in that occupation?'
People [Toggles].[COIIDDisplayLabel] aged 15+
| Occupation of employment | ||||||||
|---|---|---|---|---|---|---|---|---|
| City of Sydney - [Toggles].[COIIDDisplayLabel] | 2021 | 2011 | Change | |||||
| Occupation | Number | % | Greater Sydney | Number | % | Greater Sydney | 2011 to 2021 | |
| Managers | 11,309 | 17.2 | 15.2 | 7,095 | 15.3 | 13.3 | +4,214 | 15001 |
| Professionals | 25,440 | 38.7 | 29.3 | 16,884 | 36.4 | 25.5 | +8,556 | 15002 |
| Technicians and Trades Workers | 5,671 | 8.6 | 10.5 | 4,087 | 8.8 | 12.2 | +1,584 | 15003 |
| Community and Personal Service Workers | 5,588 | 8.5 | 9.3 | 4,600 | 9.9 | 8.8 | +988 | 15004 |
| Clerical and Administrative Workers | 6,518 | 9.9 | 13.8 | 5,737 | 12.4 | 16.2 | +781 | 15005 |
| Sales Workers | 4,108 | 6.2 | 7.8 | 3,526 | 7.6 | 9.0 | +582 | 15006 |
| Machinery Operators And Drivers | 1,753 | 2.7 | 5.6 | 745 | 1.6 | 5.7 | +1,008 | 15007 |
| Labourers | 4,155 | 6.3 | 6.8 | 2,770 | 6.0 | 7.3 | +1,385 | 15008 |
| Not stated or inadequately described | 1,253 | 1.9 | 1.9 | 964 | 2.1 | 2.0 | +289 | 15009 |
| Total employed persons aged 15+ | 65,795 | 100.0 | 100.0 | 46,408 | 100.0 | 100.0 | +19,387 | |
Source: Australian Bureau of Statistics, Census of Population and Housing (opens a new window) 2011 and 2021. Compiled and presented by .id (opens a new window)(informed decisions).
Compiled and presented in profile.id by .id (informed decisions).
Compiled and presented in profile.id by .id (informed decisions).
Dominant groups
An analysis of the jobs held by the population [Toggles].[COIIDDisplayLabel] in City of Sydney in 2021 shows the three most popular occupations were:
- Professionals (25,440 people or 38.7%)
- Managers (11,309 people or 17.2%)
- Clerical and Administrative Workers (6,518 people or 9.9%)
In combination these three occupations accounted for 43,267 people in total or 65.7603% of the employed population [Toggles].[COIIDDisplayLabel].
In comparison, Greater Sydney employed 29.3% in Professionals; 15.2% in Managers; and 13.8% in Clerical and Administrative Workers.
The major differences between the jobs held by the population [Toggles].[COIIDDisplayLabel] in the City of Sydney and Greater Sydney were:
- A larger percentage of people employed as Professionals (38.7% compared to 29.3%)
- A larger percentage of people employed as Managers (17.2% compared to 15.2%)
- A smaller percentage of people employed as Clerical and Administrative Workers (9.9% compared to 13.8%)
- A smaller percentage of people employed as Machinery Operators And Drivers (2.7% compared to 5.6%)
Emerging groups
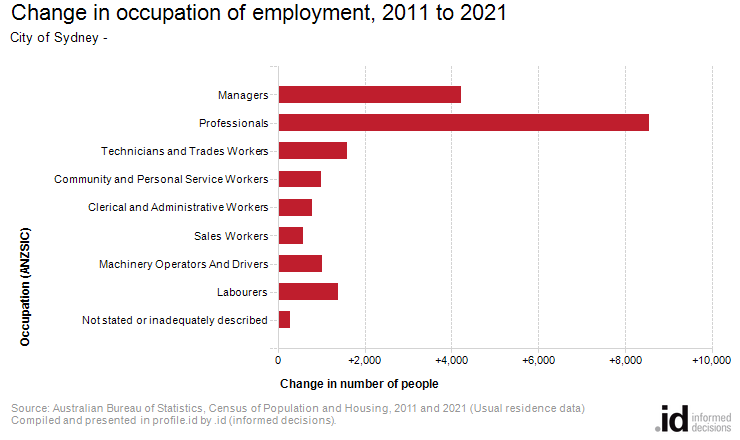
The number of employed population [Toggles].[COIIDDisplayLabel] in City of Sydney increased by 19,387 between 2011 and 2021.
The largest changes in the occupations of the population [Toggles].[COIIDDisplayLabel] between 2011 and 2021 in the City of Sydney were for those employed as:
- Professionals (+8,556 persons)
- Managers (+4,214 persons)
- Technicians and Trades Workers (+1,584 persons)
- Labourers (+1,385 persons)