Rockhampton
Age groups - Household income
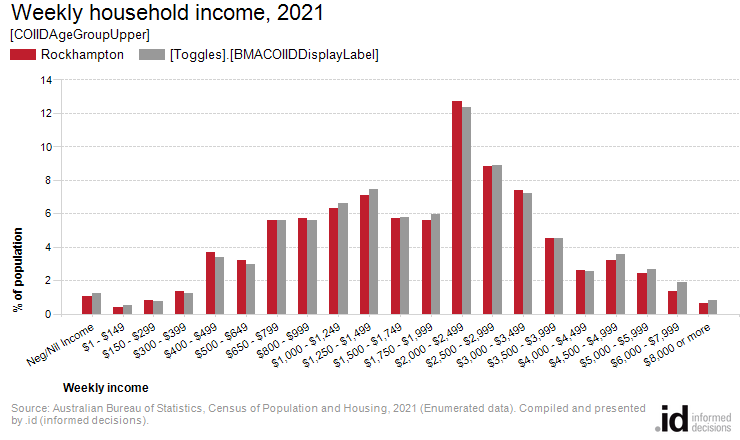
In Rockhampton, 22.2% of [COIIDAgeGroupLower] were in households earning $3,000 or more per week.
Households form the common 'economic unit' in our society. Rockhampton's Household Income is one of the most important indicators of socio-economic status. When related to age, this shows the household income of the household in which the individual of that age group was counted.
This helps to reveal the socio-economic opportunities available to people of a particular age group and the resources available to them. It can answer questions such as whether the wealth of an area is being shared equally among all ages, or particular groups, eg. children or retirees, have access to significantly higher or lower incomes than the general population.
Note that in some cases, particularly for children, this does not mean that the person in the age group actually receives the income, just that they are in a household with that income.
The incomes presented on this page are for the latest Census year only. For comparison of incomes over time go to Household Income Quartiles.
Derived from the Census question:
'What is the total of all wages/salaries, government benefits, pensions, allowances and other income the person usually receives?'
[COIIDAgeGroupUpper], counted in classifiable households
| Weekly household income | |||||||
|---|---|---|---|---|---|---|---|
| Rockhampton - | 2021 | ||||||
| Weekly income | Number | % | [Toggles].[BMACOIIDDisplayLabel] | ||||
| Neg/Nil Income | 792 | 1.1 | 1.2 | 28001 | |||
| $1 - $149 | 307 | 0.4 | 0.5 | 28002 | |||
| $150 - $299 | 595 | 0.8 | 0.8 | 28003 | |||
| $300 - $399 | 994 | 1.3 | 1.2 | 28004 | |||
| $400 - $499 | 2,754 | 3.7 | 3.4 | 28005 | |||
| $500 - $649 | 2,388 | 3.2 | 3.0 | 28006 | |||
| $650 - $799 | 4,186 | 5.6 | 5.6 | 28007 | |||
| $800 - $999 | 4,263 | 5.7 | 5.6 | 28009 | |||
| $1,000 - $1,249 | 4,694 | 6.3 | 6.6 | 28010 | |||
| $1,250 - $1,499 | 5,272 | 7.1 | 7.5 | 28011 | |||
| $1,500 - $1,749 | 4,252 | 5.7 | 5.8 | 28012 | |||
| $1,750 - $1,999 | 4,155 | 5.6 | 6.0 | 28013 | |||
| $2,000 - $2,499 | 9,470 | 12.7 | 12.4 | 28014 | |||
| $2,500 - $2,999 | 6,578 | 8.8 | 8.9 | 28015 | |||
| $3,000 - $3,499 | 5,502 | 7.4 | 7.2 | 28016 | |||
| $3,500 - $3,999 | 3,378 | 4.5 | 4.5 | 28017 | |||
| $4,000 - $4,499 | 1,954 | 2.6 | 2.5 | 28018 | |||
| $4,500 - $4,999 | 2,408 | 3.2 | 3.5 | 28019 | |||
| $5,000 - $5,999 | 1,800 | 2.4 | 2.7 | 28020 | |||
| $6,000 - $7,999 | 998 | 1.3 | 1.9 | 28021 | |||
| $8,000 or more | 467 | 0.6 | 0.8 | 28022 | |||
| Not stated | 7,274 | 9.8 | 8.6 | 28098 | |||
| Total people in classifiable households | 74,481 | 100.0 | 100.0 | ||||
Source: Australian Bureau of Statistics, Census of Population and Housing (opens a new window) 2021 (Enumerated data). Compiled and presented in profile.id by .id (opens a new window) (informed decisions).
Dominant groups
Analysis of household income levels for [COIIDAgeGroupLower] in Rockhampton in 2021 compared to [theCOIBM] shows that there was a smaller proportion of [COIIDAgeGroupLower] in high income households (those earning $3,000 per week or more) and a similar proportion in low income households (those earning less than $800 per week).
Overall, 22.2% of [COIIDAgeGroupLower] were in households that earned a high income, and 16.1% were in low income households, compared with 23.1% and 15.7% respectively for [theCOIBM].
There were no major differences between Rockhampton and [theCOIBM] in 2021.