City of Playford
Non-English speakers - Household type
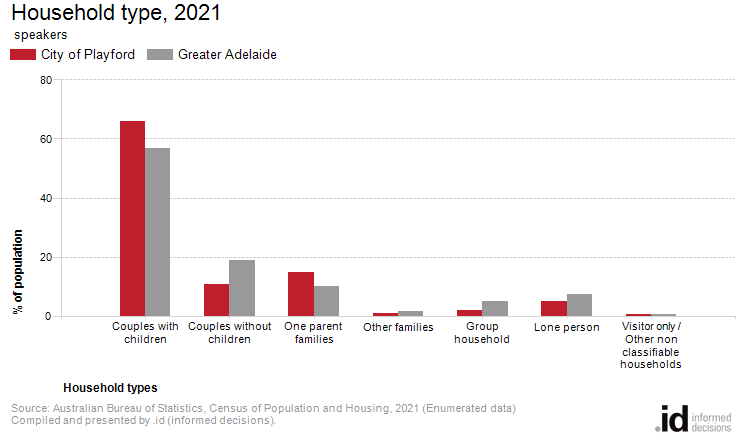
In the City of Playford, 66.0% of [Toggles].[COIIDDisplayLabel] speakers were in couples with children households.
The City of Playford's household and family structure is one of the most important demographic indicators. For the non-English speaking population, only those family members who speak a language other than English at home are counted. Other family members who may speak English at home are not included in the table.
This topic reveals the area's residential role and function for the non-English speaking population and what type of households they are forming. This is likely to be strongly related to Age Structure - while recent migrants are young and likely to form families (and group households in the case of student areas), more established migrant communities may have older families and empty nesters in their mix of households.
To continue building the story of those speaking a language other than English in City of Playford, please look at this topic in conjunction with Age Structure, Household Size and Number of Bedrooms.
Derived from the Census question:
'What is the person's relationship (to each other person in the household)?'
People speaking [COIIDLabelForLanguage] at home, counted in private dwellings
| Household type | ||||||||
|---|---|---|---|---|---|---|---|---|
| City of Playford - [Toggles].[COIIDDisplayLabel] | 2021 | 2016 | Change | |||||
| Households by type | Number | % | Greater Adelaide | Number | % | Greater Adelaide | 2016 to 2021 | |
| Couples with children | 9,910 | 66.0 | 56.8 | 7,013 | 63.3 | 54.7 | +2,897 | 19500 |
| Couples without children | 1,620 | 10.8 | 18.8 | 1,307 | 11.8 | 19.1 | +313 | 19501 |
| One parent families | 2,221 | 14.8 | 10.2 | 1,672 | 15.1 | 10.5 | +549 | 19502 |
| Other families | 149 | 1.0 | 1.4 | 139 | 1.3 | 1.5 | +10 | 19503 |
| Group household | 287 | 1.9 | 5.0 | 258 | 2.3 | 5.6 | +29 | 19504 |
| Lone person | 732 | 4.9 | 7.5 | 588 | 5.3 | 8.1 | +144 | 19505 |
| Visitor only / Other non classifiable households | 93 | 0.6 | 0.4 | 108 | 1.0 | 0.5 | -15 | 19507 |
| Total persons counted in private dwellings | 15,012 | 100.0 | 100.0 | 11,085 | 100.0 | 100.0 | +3,927 | |
Source: Australian Bureau of Statistics, Census of Population and Housing (opens a new window) 2016 and 2021. Compiled and presented by .id (opens a new window)(informed decisions).
Compiled and presented by .id (informed decisions).
Compiled and presented by .id (informed decisions).
Dominant groups
Analysis of the household/family types of [Toggles].[COIIDDisplayLabel] speakers in the City of Playford in 2021 compared to Greater Adelaide shows that there was a higher proportion of [Toggles].[COIIDDisplayLabel] speakers in couple families with child(ren) as well as a higher proportion in one-parent families. Overall, 66.0% of [Toggles].[COIIDDisplayLabel] speakers were in couple families with child(ren), and 14.8% were one-parent families, compared with 56.8% and 10.2% respectively for Greater Adelaide.
There were a lower proportion of [Toggles].[COIIDDisplayLabel] speakers in lone person households and a lower proportion in couples without children. Overall, the proportion of [Toggles].[COIIDDisplayLabel] speakers in lone person households was 4.9% compared to 7.5% in Greater Adelaide while the proportion in couples without children was 10.8% compared to 18.8% in Greater Adelaide.
Emerging groups
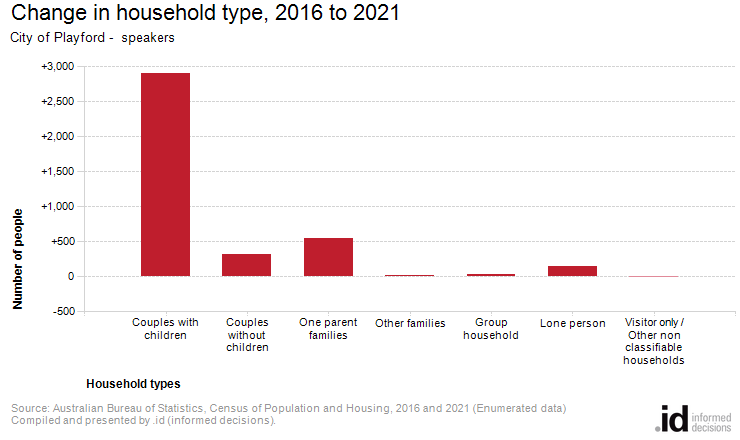
The number of [Toggles].[COIIDDisplayLabel] speakers in households in City of Playford increased by 3,927 between 2016 and 2021.
The largest changes in the family/household types of [Toggles].[COIIDDisplayLabel] speakers in the City of Playford between 2016 and 2021 were:
- Couples with children (+2,897 persons)
- One parent families (+549 persons)
- Couples without children (+313 persons)
- Lone person (+144 persons)