Port Noarlunga
Education institution attending
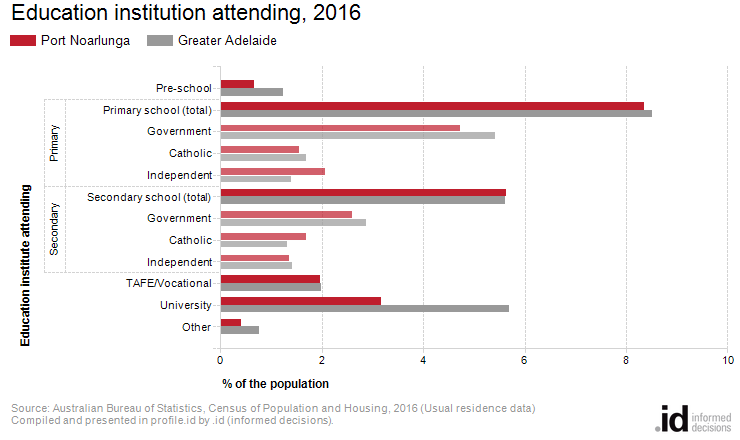
In 2016, 92 people in Port Noarlunga were attending university. This represents 3.2% of the population, compared to 5.7% in Greater Adelaide.
The share of Port Noarlunga's population attending educational institutions reflects the age structure of the population, as it is influenced by the number of children attending school; proximity to tertiary education, which can mean young adults leaving home to be nearer to educational facilities and; the degree to which people are seeking out educational opportunities in adulthood, especially in their late teens and early twenties.
This data is often combined with Age Structure to identify areas with significant university student populations.
Derived from the Census question:
'What type of educational institution is the person attending?'
Total population
| Education institution attending | ||||||||
|---|---|---|---|---|---|---|---|---|
| Port Noarlunga - Total persons (Usual residence) | 2016 | 2011 | Change | |||||
| Type of institution | Number | % | Greater Adelaide % | Number | % | Greater Adelaide % | 2011 to 2016 | |
| Pre-school | 19 | 0.7 | 1.2 | 7001 | 35 | 1.3 | 1.3 | -16 |
| Primary school | 242 | 8.4 | 8.5 | 7002 | 190 | 6.9 | 8.4 | +51 |
| Primary - Government | 137 | 4.7 | 5.4 | 7003 | 116 | 4.2 | 5.1 | +20 |
| Primary - Catholic | 45 | 1.6 | 1.7 | 7004 | 36 | 1.3 | 1.8 | +8 |
| Primary - Independent | 60 | 2.1 | 1.4 | 7005 | 36 | 1.3 | 1.5 | +23 |
| Secondary school | 163 | 5.6 | 5.6 | 7006 | 146 | 5.3 | 5.7 | +17 |
| Secondary - Government | 75 | 2.6 | 2.9 | 7007 | 75 | 2.8 | 3.0 | -1 |
| Secondary - Catholic | 49 | 1.7 | 1.3 | 7008 | 52 | 1.9 | 1.3 | -3 |
| Secondary - Independent | 39 | 1.3 | 1.4 | 7009 | 17 | 0.7 | 1.4 | +21 |
| 57 | 2.0 | 2.0 | 7010 | 63 | 2.3 | 2.3 | -7 | |
| 92 | 3.2 | 5.7 | 7011 | 60 | 2.2 | 5.0 | +32 | |
| Other | 12 | 0.4 | 0.8 | 7012 | 12 | 0.5 | 0.8 | -1 |
| 1,995 | 68.9 | 70.5 | 7013 | 2,091 | 75.8 | 70.6 | -97 | |
| Not stated | 316 | 10.9 | 5.7 | 7014 | 160 | 5.8 | 5.9 | +156 |
| Total | 2,896 | 100.0 | 100.0 | 2,761 | 100.0 | 100.0 | +135 | |
Source: Australian Bureau of Statistics, Census of Population and Housing (opens a new window) 2011 and 2016. Compiled and presented by .id (opens a new window)(informed decisions).
(Usual residence data)
Compiled and presented in profile.id by .id (informed decisions).
Compiled and presented in profile.id by .id (informed decisions).
Dominant groups
Analysis of the share of the population attending educational institutions in Port Noarlunga in 2016 compared to Greater Adelaide shows that there was a similar proportion attending primary school, a similar proportion attending secondary school, and a lower proportion engaged in tertiary level education.
Overall, 8.4% of the population were attending primary school, 5.6% of the population were attending secondary institutions, and 5.1% were learning at a tertiary level, compared with 8.5%, 5.6% and 7.7% respectively for Greater Adelaide.
The major differences between the share of the population attending learning institutions in Port Noarlunga and Greater Adelaide were:
- A smaller percentage of persons attending University (3.2% compared to 5.7%)
- A smaller percentage of persons not attending (68.9% compared to 70.5%)
Emerging groups
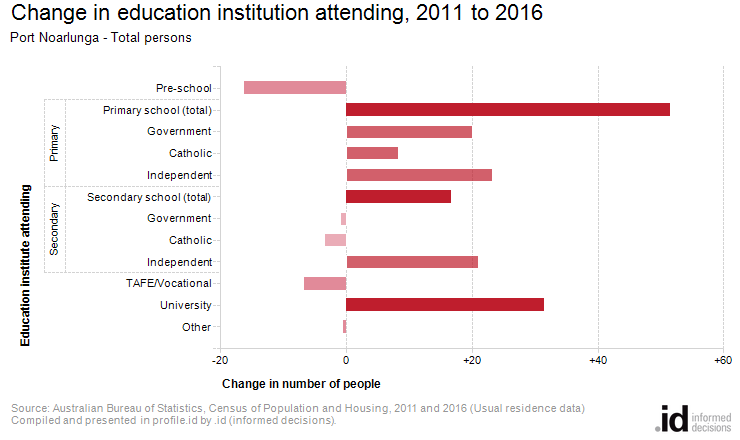
From 2011 to 2016, Port Noarlunga's population increased by 143 people (+5.2%). This represents an average annual change of 1.02% per year over the period.
The largest change in the number of persons attending education institutions in Port Noarlunga, between 2011 and 2016 was in those who nominated:
- Primary school (+51 persons)