Northern Beaches Council area
Aboriginal and Torres Strait Islander profile - Employment status
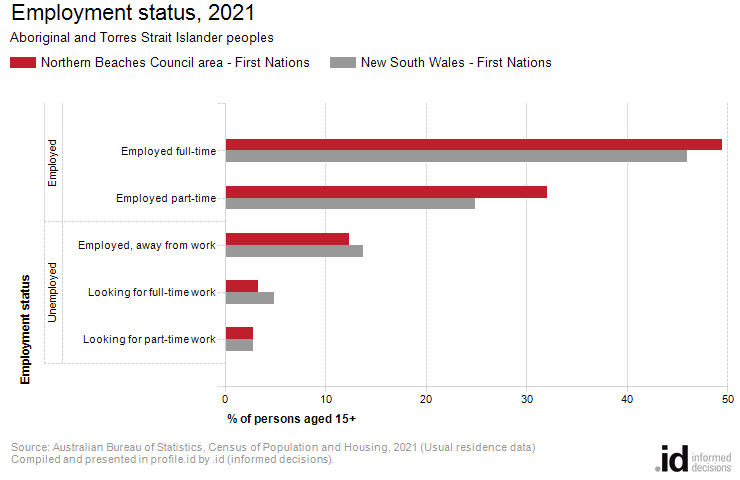
849 Aboriginal and Torres Strait Islander people living in the Northern Beaches Council area are employed, of which 53% are working full time and 34% part time.
Employment statistics are an important indicator of socio-economic status, as well as the availability of jobs. The levels of full or part-time employment, unemployment and labour force participation among the First Nations population indicate the availability of jobs, and the match of skill levels within the population to the jobs available. A high unemployment rate or a low participation rate may indicate a relatively disadvantaged population unable to access community infrastructure.
Employment status is linked to a number of factors including Age Structure, which influences the number of people in the workforce; the economic base and employment opportunities available in the area and the education and skill base of the population (Occupations, Qualifications).
Derived from the Census question:
'Last week did the person have a full time or part time job of any kind?'
Persons aged 15 years and over
| Employment status | ||||||||
|---|---|---|---|---|---|---|---|---|
| Aboriginal and Torres Strait Islander peoples - Northern Beaches Council area | 2021 | 2011 | Change | |||||
| Employment status | Number | % | New South Wales - First Nations % | Number | % | New South Wales - First Nations % | 2011 to 2021 | |
| Employed | 849 | 93.9 | 92.3 | 440 | 93.4 | 86.8 | +409 | 13000 |
| Employed full-time | 447 | 49.4 | 46.0 | 291 | 61.8 | 54.5 | +156 | 13001 |
| Employed part-time | 290 | 32.1 | 24.9 | 126 | 26.8 | 25.2 | +164 | 13002 |
| Employed, away from work | 112 | 12.4 | 13.8 | 23 | 4.9 | 7.1 | +89 | 13003 |
| Unemployed (Unemployment rate) | 55 | 6.1 | 7.7 | 31 | 6.6 | 13.2 | +24 | 13004 |
| Looking for full-time work | 30 | 3.3 | 4.8 | 22 | 4.7 | 9.1 | +8 | 13005 |
| Looking for part-time work | 25 | 2.8 | 2.8 | 9 | 1.9 | 4.0 | +16 | 13006 |
| Total labour force | 904 | 100.0 | 100.0 | 471 | 100.0 | 100.0 | +433 | |
Source: Australian Bureau of Statistics, Census of Population and Housing (opens a new window) 2011 and 2021. Compiled and presented by .id (opens a new window)(informed decisions).
(Usual residence data)
| Labour force status | ||||||||
|---|---|---|---|---|---|---|---|---|
| Aboriginal and Torres Strait Islander peoples - Northern Beaches Council area | 2021 | 2011 | Change | |||||
| Labour force status | Number | % | New South Wales - First Nations % | Number | % | New South Wales - First Nations % | 2011 to 2021 | |
| Total labour force | 904 | 72.4 | 60.0 | 471 | 69.3 | 56.1 | +433 | 13099 |
| Not in the labour force | 326 | 26.1 | 38.1 | 199 | 29.3 | 40.5 | +127 | 13501 |
| Labour force status not stated | 18 | 1.4 | 2.0 | 10 | 1.5 | 3.4 | +8 | 13502 |
| Total people aged 15+ | 1,248 | 100.0 | 100.0 | 680 | 100.0 | 100.0 | +568 | |
Source: Australian Bureau of Statistics, Census of Population and Housing (opens a new window) 2011 and 2021. Compiled and presented by .id (opens a new window)(informed decisions).
(Usual residence data)
Compiled and presented in profile.id by .id (informed decisions).
Compiled and presented in profile.id by .id (informed decisions).
Emerging groups
The size of the Northern Beaches Council area's Aboriginal and Torres Strait Islander labour force in 2021 was 904 people, of which 290 were employed part-time and 447 were full-time workers.
Analysis of the employment status (as a percentage of the labour force) of the Aboriginal and Torres Strait Islander population in the Northern Beaches Council area in 2021 compared to Aboriginal and Torres Strait Islander population of New South Wales shows that there was a lower proportion in employment, as well as a lower proportion unemployed. The unemployed Aboriginal and Torres Strait Islander labour force was 6.1%, compared with 7.7% of the Aboriginal and Torres Strait Islander population in New South Wales.
The labour force participation rate refers to the proportion of the population over 15 years of age that was employed or actively looking for work.
Analysis of the labour force participation rate of the Aboriginal and Torres Strait Islander population in the Northern Beaches Council area in 2021 shows that there was a higher proportion in the labour force (72.4%) compared with the Aboriginal and Torres Strait Islander population in New South Wales (60.0%).
Emerging groups
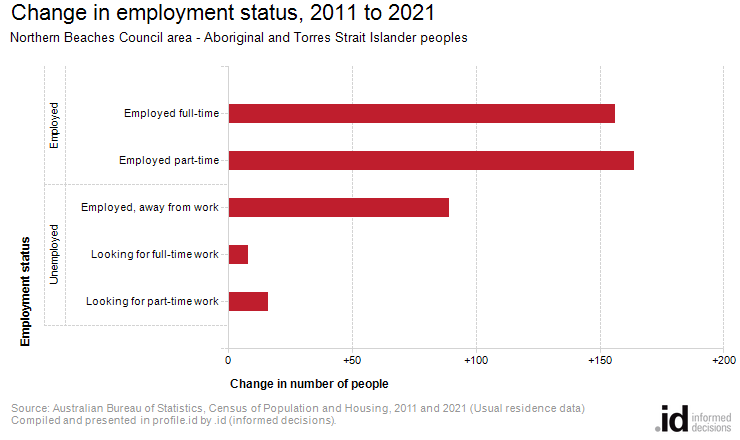
Between 2011 and 2021, the number of Aboriginal and Torres Strait Islander people employed in the Northern Beaches Council area showed an increase of 409 people and the number unemployed showed an increase of 24 people. In the same period, the number of Aboriginal and Torres Strait Islander people in the labour force showed an increase of 433 people, or 91.9%.