Campbelltown City
Population highlights
|
Estimated Resident Population
Campbelltown City 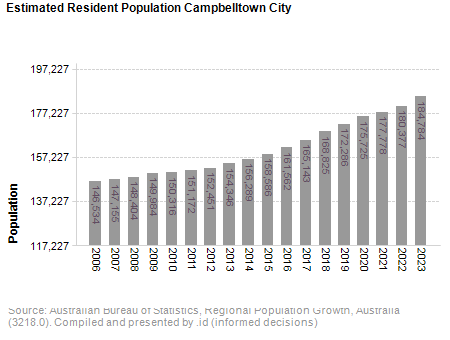
Source: Australian Bureau of Statistics, Regional Population Growth, Australia (3218.0). Compiled and presented by .id (informed decisions)
|
||
Campbelltown City
Campbelltown City 2021
National Growth Areas Alliance (NGAA) 35
Greater Sydney 37
National Growth Areas Alliance (NGAA) 3%
Greater Sydney 2%
National Growth Areas Alliance (NGAA) 39%
Greater Sydney 34%
National Growth Areas Alliance (NGAA) 8%
Greater Sydney 9%
National Growth Areas Alliance (NGAA) 18%
Greater Sydney 22%
National Growth Areas Alliance (NGAA) 15%
Greater Sydney 46%
National Growth Areas Alliance (NGAA) $1,827
Greater Sydney $2,099
National Growth Areas Alliance (NGAA) $443
Greater Sydney $560
National Growth Areas Alliance (NGAA) $371
Greater Sydney $470
National Growth Areas Alliance (NGAA) 27%
Greater Sydney 35%
National Growth Areas Alliance (NGAA) 43%
Greater Sydney 32%
National Growth Areas Alliance (NGAA) 33%
Greater Sydney 39%
National Growth Areas Alliance (NGAA) 29%
Greater Sydney 37%
National Growth Areas Alliance (NGAA) 4%
Greater Sydney 6%
National Growth Areas Alliance (NGAA) 21%
Greater Sydney 33%
National Growth Areas Alliance (NGAA) 21%
Greater Sydney 15%
National Growth Areas Alliance (NGAA) 5.9%
Greater Sydney 5.1%
National Growth Areas Alliance (NGAA) 63%
Greater Sydney 60%
National Growth Areas Alliance (NGAA) 18%
Greater Sydney 39%
National Growth Areas Alliance (NGAA) 986
Greater Sydney 1,010