City of Melton
Non-English speakers - Birthplace
In 2021, 31.0% of the [Toggles].[COIIDDisplayLabel] speaking population in the City of Melton were born in Australia.
People speaking a language other than English at home may have been born in a variety of different countries. Second and third generation migrants may be born in Australia. This topic looks at the distribution of birthplaces for non-English language speakers only. It is likely to vary depending on which communities exist in the local area. Some countries may have multiple languages represented, in different parts of the country (eg. India), while other languages are spoken in a range of countries (e.g. Spanish, Arabic). This topic is another tool to pinpoint the particular cultural groups forming your community.
Derived from the Census question:
'In which country was the person born?'
People using [COIIDLabelForLanguage] at home and born overseas
| Birthplace - Ranked by size | ||||||||
|---|---|---|---|---|---|---|---|---|
| City of Melton - [Toggles].[COIIDDisplayLabel] speakers | 2021 | 2011 | Change | |||||
| Birthplace | Number | % | Greater Melbourne | Number | % | Greater Melbourne | 2011 to 2021 | |
| India | 13,038 | 18.7 | 4.9 | 30113 | 2,085 | 6.6 | 2.7 | +10,953 |
| Philippines | 4,733 | 6.8 | 1.2 | 30195 | 2,325 | 7.4 | 0.8 | +2,408 |
| Vietnam | 2,798 | 4.0 | 1.8 | 30270 | 1,290 | 4.1 | 1.7 | +1,508 |
| Sri Lanka | 1,565 | 2.2 | 1.3 | 30235 | 679 | 2.1 | 1.1 | +886 |
| Pakistan | 1,554 | 2.2 | 0.6 | 30189 | 348 | 1.1 | 0.2 | +1,206 |
| Malta | 1,265 | 1.8 | 0.3 | 30149 | 1,238 | 3.9 | 0.5 | +27 |
| North Macedonia | 1,240 | 1.8 | 0.4 | 30084 | 946 | 3.0 | 0.4 | +294 |
| New Zealand | 1,158 | 1.7 | 1.7 | 30172 | 409 | 1.3 | 1.7 | +749 |
| Iraq | 1,133 | 1.6 | 0.5 | 30116 | 144 | 0.5 | 0.3 | +989 |
| China (excludes SARs and Taiwan) | 891 | 1.3 | 3.4 | 30053 | 574 | 1.8 | 2.3 | +317 |
| Egypt | 874 | 1.3 | 0.3 | 30073 | 424 | 1.3 | 0.3 | +450 |
| Samoa | 714 | 1.0 | 0.1 | 30207 | 208 | 0.7 | 0.1 | +506 |
| Italy | 693 | 1.0 | 1.2 | 30120 | 699 | 2.2 | 1.7 | -6 |
| Croatia | 669 | 1.0 | 0.3 | 30062 | 565 | 1.8 | 0.4 | +104 |
| Ethiopia | 639 | 0.9 | 0.2 | 30079 | 269 | 0.9 | 0.1 | +370 |
| Myanmar | 620 | 0.9 | 0.3 | 30039 | 24 | 0.1 | 0.1 | +596 |
| Bangladesh | 614 | 0.9 | 0.2 | 30022 | 107 | 0.3 | 0.1 | +507 |
| Bosnia and Herzegovina | 612 | 0.9 | 0.2 | 30032 | 417 | 1.3 | 0.2 | +195 |
| Fiji | 580 | 0.8 | 0.2 | 30082 | 335 | 1.1 | 0.2 | +245 |
| Sudan | 575 | 0.8 | 0.1 | 30240 | 291 | 0.9 | 0.1 | +284 |
| Malaysia | 530 | 0.8 | 1.2 | 30146 | 274 | 0.9 | 1.0 | +256 |
| Chile | 527 | 0.8 | 0.2 | 30052 | 417 | 1.3 | 0.2 | +110 |
| South Sudan | 487 | 0.7 | 0.1 | 30226 | 112 | 0.4 | 0.0 | +375 |
| Timor-Leste | 474 | 0.7 | 0.1 | 30250 | 405 | 1.3 | 0.1 | +69 |
| Serbia | 454 | 0.7 | 0.2 | 30214 | 270 | 0.9 | 0.2 | +184 |
| Cyprus | 401 | 0.6 | 0.1 | 30065 | 387 | 1.2 | 0.2 | +14 |
| Lebanon | 401 | 0.6 | 0.4 | 30135 | 250 | 0.8 | 0.4 | +151 |
| Thailand | 366 | 0.5 | 0.4 | 30249 | 139 | 0.4 | 0.2 | +227 |
| El Salvador | 333 | 0.5 | 0.1 | 30074 | 315 | 1.0 | 0.1 | +18 |
| Greece | 323 | 0.5 | 0.9 | 30096 | 285 | 0.9 | 1.2 | +38 |
| Indonesia | 316 | 0.5 | 0.4 | 30114 | 190 | 0.6 | 0.4 | +126 |
| Nepal | 300 | 0.4 | 0.4 | 30169 | 5 | 0.0 | 0.1 | +295 |
| Afghanistan | 300 | 0.4 | 0.5 | 30001 | 100 | 0.3 | 0.2 | +200 |
| Turkey | 297 | 0.4 | 0.4 | 30257 | 193 | 0.6 | 0.4 | +104 |
| Poland | 297 | 0.4 | 0.3 | 30197 | 312 | 1.0 | 0.4 | -15 |
| Iran | 257 | 0.4 | 0.4 | 30115 | 52 | 0.2 | 0.2 | +205 |
| South Eastern Europe, nfd | 234 | 0.3 | 0.1 | 30225 | 203 | 0.6 | 0.2 | +31 |
| Kenya | 218 | 0.3 | 0.1 | 30126 | 39 | 0.1 | 0.1 | +179 |
| Mauritius | 190 | 0.3 | 0.2 | 30154 | 98 | 0.3 | 0.3 | +92 |
| Korea, Republic of (South) | 184 | 0.3 | 0.3 | 30129 | 103 | 0.3 | 0.2 | +81 |
| Singapore | 181 | 0.3 | 0.3 | 30217 | 131 | 0.4 | 0.3 | +50 |
| Romania | 171 | 0.2 | 0.1 | 30204 | 123 | 0.4 | 0.1 | +48 |
| Germany | 167 | 0.2 | 0.4 | 30092 | 202 | 0.6 | 0.5 | -35 |
| Hong Kong (SAR of China) | 165 | 0.2 | 0.5 | 30109 | 106 | 0.3 | 0.4 | +59 |
| Nigeria | 165 | 0.2 | 0.0 | 30175 | 49 | 0.2 | 0.0 | +116 |
| Portugal | 157 | 0.2 | 0.1 | 30200 | 126 | 0.4 | 0.1 | +31 |
| Albania | 155 | 0.2 | 0.0 | 30003 | 104 | 0.3 | 0.0 | +51 |
| Argentina | 152 | 0.2 | 0.1 | 30011 | 114 | 0.4 | 0.1 | +38 |
| Syria | 151 | 0.2 | 0.2 | 30245 | 31 | 0.1 | 0.1 | +120 |
| Zimbabwe | 151 | 0.2 | 0.1 | 30278 | 39 | 0.1 | 0.1 | +112 |
| United Arab Emirates | 150 | 0.2 | 0.1 | 30263 | 25 | 0.1 | 0.0 | +125 |
| Congo, Democratic Republic of | 149 | 0.2 | 0.0 | 30057 | 0 | 0.0 | 0.0 | +149 |
| United Kingdom | 147 | 0.2 | 0.0 | 30075 | 98 | 0.3 | 4.1 | +49 |
| Eritrea | 136 | 0.2 | 0.1 | 30077 | 36 | 0.1 | 0.0 | +100 |
| Tonga | 127 | 0.2 | 0.0 | 30253 | 59 | 0.2 | 0.0 | +68 |
| Kosovo | 111 | 0.2 | 0.0 | 30130 | 44 | 0.1 | 0.0 | +67 |
| South Africa | 104 | 0.1 | 0.6 | 30223 | 69 | 0.2 | 0.5 | +35 |
| Colombia | 100 | 0.1 | 0.2 | 30055 | 22 | 0.1 | 0.1 | +78 |
| Bhutan | 94 | 0.1 | 0.0 | 30029 | 0 | 0.0 | 0.0 | +94 |
| Laos | 94 | 0.1 | 0.0 | 30133 | 81 | 0.3 | 0.1 | +13 |
| Saudi Arabia | 91 | 0.1 | 0.1 | 30211 | 16 | 0.1 | 0.1 | +75 |
| Spain | 87 | 0.1 | 0.1 | 30234 | 75 | 0.2 | 0.1 | +12 |
| Tanzania | 78 | 0.1 | 0.0 | 30248 | 3 | 0.0 | 0.0 | +75 |
| United States of America | 77 | 0.1 | 0.4 | 30265 | 22 | 0.1 | 0.4 | +55 |
| Uruguay | 77 | 0.1 | 0.0 | 30266 | 71 | 0.2 | 0.0 | +6 |
| Taiwan | 73 | 0.1 | 0.2 | 30246 | 47 | 0.1 | 0.1 | +26 |
| Southern Asia, nfd | 70 | 0.1 | 0.0 | 30232 | 0 | 0.0 | 0.0 | +70 |
| Russian Federation | 70 | 0.1 | 0.1 | 30205 | 41 | 0.1 | 0.1 | +29 |
| Japan | 69 | 0.1 | 0.2 | 30122 | 46 | 0.1 | 0.2 | +23 |
| Cambodia | 69 | 0.1 | 0.3 | 30042 | 30 | 0.1 | 0.3 | +39 |
| Liberia | 61 | 0.1 | 0.0 | 30137 | 0 | 0.0 | 0.0 | +61 |
| Kuwait | 60 | 0.1 | 0.0 | 30131 | 18 | 0.1 | 0.0 | +42 |
| Brazil | 60 | 0.1 | 0.1 | 30034 | 45 | 0.1 | 0.0 | +15 |
| Congo, Republic of | 53 | 0.1 | 0.0 | 30058 | 4 | 0.0 | 0.0 | +49 |
| Jordan | 52 | 0.1 | 0.0 | 30124 | 24 | 0.1 | 0.0 | +28 |
| Peru | 49 | 0.1 | 0.0 | 30194 | 36 | 0.1 | 0.0 | +13 |
| Uganda | 47 | 0.1 | 0.0 | 30261 | 0 | 0.0 | 0.0 | +47 |
| Somalia | 45 | 0.1 | 0.1 | 30222 | 11 | 0.0 | 0.1 | +34 |
| Burundi | 42 | 0.1 | 0.0 | 30040 | 0 | 0.0 | 0.0 | +42 |
| Netherlands | 39 | 0.1 | 0.2 | 30170 | 64 | 0.2 | 0.3 | -25 |
| Montenegro | 37 | 0.1 | 0.0 | 30163 | 27 | 0.1 | 0.0 | +10 |
| France | 37 | 0.1 | 0.1 | 30085 | 26 | 0.1 | 0.1 | +11 |
| Ghana | 36 | 0.1 | 0.0 | 30093 | 10 | 0.0 | 0.0 | +26 |
| Mexico | 34 | 0.0 | 0.0 | 30156 | 24 | 0.1 | 0.0 | +10 |
| Sierra Leone | 33 | 0.0 | 0.0 | 30216 | 14 | 0.0 | 0.0 | +19 |
| Libya | 31 | 0.0 | 0.0 | 30138 | 21 | 0.1 | 0.0 | +10 |
| Hungary | 30 | 0.0 | 0.1 | 30110 | 36 | 0.1 | 0.1 | -6 |
| Austria | 23 | 0.0 | 0.1 | 30018 | 28 | 0.1 | 0.1 | -5 |
| Morocco | 22 | 0.0 | 0.0 | 30165 | 14 | 0.0 | 0.0 | +8 |
| Mozambique | 22 | 0.0 | 0.0 | 30166 | 0 | 0.0 | 0.0 | +22 |
| Ukraine | 21 | 0.0 | 0.1 | 30262 | 16 | 0.1 | 0.1 | +5 |
| Slovenia | 19 | 0.0 | 0.0 | 30220 | 15 | 0.0 | 0.0 | +4 |
| Qatar | 19 | 0.0 | 0.0 | 30202 | 0 | 0.0 | 0.0 | +19 |
| Canada | 19 | 0.0 | 0.2 | 30044 | 12 | 0.0 | 0.2 | +7 |
| Cook Islands | 19 | 0.0 | 0.0 | 30059 | 6 | 0.0 | 0.0 | +13 |
| Gaza Strip and West Bank | 18 | 0.0 | 0.0 | 30090 | 11 | 0.0 | 0.0 | +7 |
| Nauru | 18 | 0.0 | 0.0 | 30168 | 7 | 0.0 | 0.0 | +11 |
| Slovakia | 18 | 0.0 | 0.0 | 30219 | 19 | 0.1 | 0.0 | -1 |
| Zambia | 16 | 0.0 | 0.0 | 30277 | 3 | 0.0 | 0.0 | +13 |
| Tuvalu | 14 | 0.0 | 0.0 | 30260 | 3 | 0.0 | 0.0 | +11 |
| Oman | 13 | 0.0 | 0.0 | 30188 | 6 | 0.0 | 0.0 | +7 |
| Samoa, American | 13 | 0.0 | 0.0 | 30208 | 3 | 0.0 | 0.0 | +10 |
| Algeria | 13 | 0.0 | 0.0 | 30004 | 0 | 0.0 | 0.0 | +13 |
| Czech Republic | 11 | 0.0 | 0.0 | 30066 | 4 | 0.0 | 0.0 | +7 |
| Guinea | 11 | 0.0 | 0.0 | 30103 | 0 | 0.0 | 0.0 | +11 |
| Ireland | 11 | 0.0 | 0.3 | 30117 | 4 | 0.0 | 0.3 | +7 |
| Solomon Islands | 11 | 0.0 | 0.0 | 30221 | 7 | 0.0 | 0.0 | +4 |
| Switzerland | 11 | 0.0 | 0.0 | 30244 | 5 | 0.0 | 0.0 | +6 |
| Rwanda | 10 | 0.0 | 0.0 | 30206 | 0 | 0.0 | 0.0 | +10 |
| Niue | 10 | 0.0 | 0.0 | 30176 | 0 | 0.0 | 0.0 | +10 |
| Eastern Europe, nfd | 10 | 0.0 | 0.0 | 30071 | 11 | 0.0 | 0.0 | -1 |
| Cote d'Ivoire | 10 | 0.0 | 0.0 | 30061 | 3 | 0.0 | 0.0 | +7 |
| Belgium | 10 | 0.0 | 0.0 | 30025 | 8 | 0.0 | 0.0 | +2 |
| Show me more! | ||||||||
Source: Australian Bureau of Statistics, Census of Population and Housing (opens a new window) 2011 and 2021. Compiled and presented by .id (opens a new window)(informed decisions).
Excludes countries with fewer than 10 people.
| Birthplace - Summary | ||||||||
|---|---|---|---|---|---|---|---|---|
| City of Melton - [Toggles].[COIIDDisplayLabel] speakers | 2021 | 2011 | Change | |||||
| Birthplace | Number | % | Greater Melbourne | Number | % | Greater Melbourne | 2011 to 2021 | |
| Overseas born | 47,742 | 68.5 | 35.6 | 38000 | 20,078 | 63.5 | 31.5 | +27,664 |
| Australia | 21,591 | 31.0 | 59.9 | 38004 | 10,945 | 34.6 | 63.2 | +10,646 |
| Not stated | 383 | 0.5 | 4.5 | 38009 | 592 | 1.9 | 5.3 | -209 |
| Total people | 69,716 | 100.0 | 100.0 | 31,615 | 100.0 | 100.0 | +38,101 | |
Source: Australian Bureau of Statistics, Census of Population and Housing (opens a new window) 2011 and 2021. Compiled and presented by .id (opens a new window)(informed decisions).

Compiled and presented in profile.id by .id (informed decisions).
Compiled and presented in profile.id by .id (informed decisions).
Dominant groups
Analysis of the country of birth of the [Toggles].[COIIDDisplayLabel] speaking population in the City of Melton in 2021 compared to Greater Melbourne shows that there was a larger proportion of people born overseas.
Overall, 68.5% of the [Toggles].[COIIDDisplayLabel] speaking population was born overseas, compared with 35.6% for Greater Melbourne.
The major differences between the countries of birth of the [Toggles].[COIIDDisplayLabel] speaking population in the City of Melton and Greater Melbourne were:
- A larger percentage of people born in India (18.7% compared to 4.9%)
- A larger percentage of people born in Philippines (6.8% compared to 1.2%)
- A larger percentage of people born in Vietnam (4.0% compared to 1.8%)
- A smaller percentage of people born in China (excludes SARs and Taiwan) (1.3% compared to 3.4%)
Emerging groups
Between 2011 and 2021, the number of [Toggles].[COIIDDisplayLabel] speakers born overseas increased by 27,664 or 137.8%,
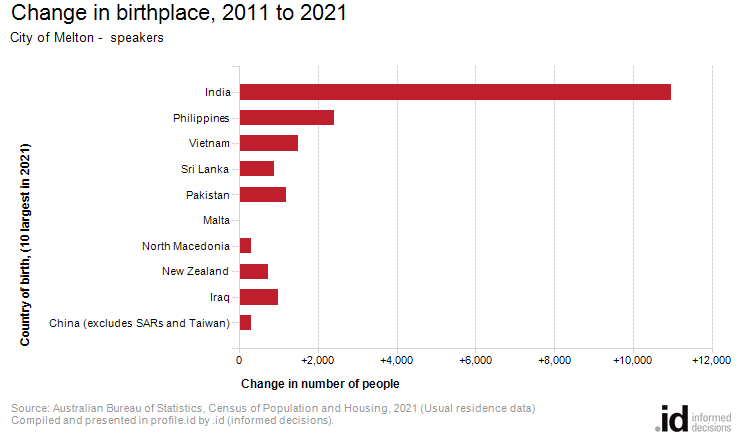
The largest changes in birthplace countries of the [Toggles].[COIIDDisplayLabel] speaking population in this area between 2011 and 2021 were for those born in:
- India (+10,953 persons)
- Philippines (+2,408 persons)
- Vietnam (+1,508 persons)
- Pakistan (+1,206 persons)