City of Manningham
Overseas born - Household income
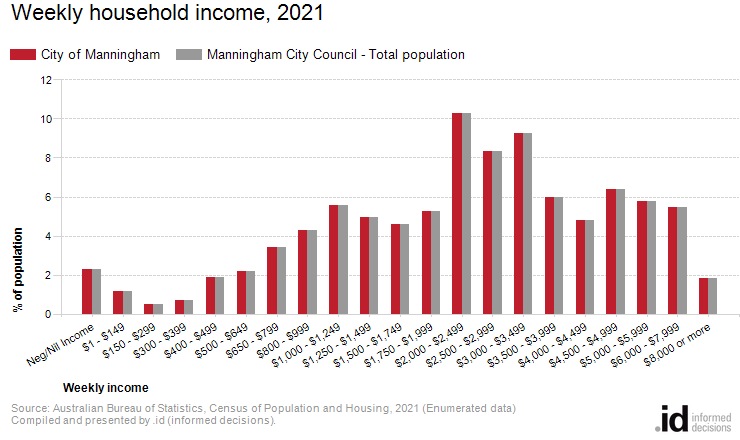
In City of Manningham, 39.5% of people [Toggles].[COIIDDisplayLabel] were in households earning an income of $3,000 or more per week.
Households form the common 'economic unit' in our society. City of Manningham's Household Income is one of the most important indicators of socio-economic status. With other data sources, such as Educational Qualifications and Occupation, it helps to reveal the economic opportunities and socio-economic status of the overseas-born population in City of Manningham.
Income for the overseas-born population may be lower or higher than the total population. Some areas with many recent migrants, particularly students and refugees, may have lower incomes, though if they are sponsored business migrants the effect may be the opposite. This topic helps quantify the difference between the incomes of Australian and overseas-born for the area, to assist in targeting services to these communities.
Derived from the Census question:
'What is the total of all wages/salaries, government benefits, pensions, allowances and other income the person usually receives?'
people [Toggles].[COIIDDisplayLabel], counted in private dwellings
| Weekly household income | |||||||
|---|---|---|---|---|---|---|---|
| City of Manningham - [Toggles].[COIIDDisplayLabel] | 2021 | ||||||
| Weekly income | Number | % | Manningham City Council - Total population | ||||
| Neg/Nil Income | 107 | 2.3 | 2.3 | 28001 | |||
| $1 - $149 | 54 | 1.1 | 1.1 | 28002 | |||
| $150 - $299 | 22 | 0.5 | 0.5 | 28003 | |||
| $300 - $399 | 33 | 0.7 | 0.7 | 28004 | |||
| $400 - $499 | 88 | 1.9 | 1.9 | 28005 | |||
| $500 - $649 | 103 | 2.2 | 2.2 | 28006 | |||
| $650 - $799 | 161 | 3.4 | 3.4 | 28007 | |||
| $800 - $999 | 201 | 4.3 | 4.3 | 28009 | |||
| $1,000 - $1,249 | 262 | 5.6 | 5.6 | 28010 | |||
| $1,250 - $1,499 | 233 | 5.0 | 5.0 | 28011 | |||
| $1,500 - $1,749 | 217 | 4.6 | 4.6 | 28012 | |||
| $1,750 - $1,999 | 246 | 5.2 | 5.2 | 28013 | |||
| $2,000 - $2,499 | 483 | 10.3 | 10.3 | 28014 | |||
| $2,500 - $2,999 | 392 | 8.3 | 8.3 | 28015 | |||
| $3,000 - $3,499 | 435 | 9.3 | 9.3 | 28016 | |||
| $3,500 - $3,999 | 282 | 6.0 | 6.0 | 28017 | |||
| $4,000 - $4,499 | 225 | 4.8 | 4.8 | 28018 | |||
| $4,500 - $4,999 | 300 | 6.4 | 6.4 | 28019 | |||
| $5,000 - $5,999 | 272 | 5.8 | 5.8 | 28020 | |||
| $6,000 - $7,999 | 257 | 5.5 | 5.5 | 28021 | |||
| $8,000 or more | 86 | 1.8 | 1.8 | 28022 | |||
| Not stated | 242 | 5.1 | 5.1 | 28098 | |||
| Total people | 4,701 | 100.0 | 100.0 | ||||
Source: Australian Bureau of Statistics, Census of Population and Housing (opens a new window) 2021 (Enumerated data). Compiled and presented in profile.id by .id (opens a new window) (informed decisions).
Compiled and presented by .id (informed decisions).
Dominant groups
Analysis of household income levels for people [Toggles].[COIIDDisplayLabel] in City of Manningham in 2021 compared to the total population shows that there was a similar proportion of people [Toggles].[COIIDDisplayLabel] in high income households (those earning $3,000 per week or more) as well as a similar proportion in low income households (those earning less than $800 per week).
Overall, 39.5% of people [Toggles].[COIIDDisplayLabel] were in households that earned a high income, and 12.1% were in low income households, compared with 39.5% and 12.1% respectively for the total population.
There were no major differences between the population [Toggles].[COIIDDisplayLabel] in City of Manningham and the total population in 2021.