City of Manningham
Non-English speakers - Household income quartiles
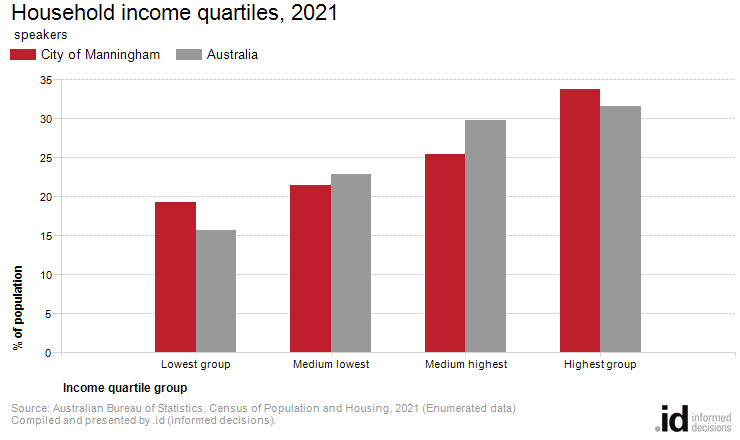
In City of Manningham, the 'highest' quartile was the largest group in 2021, comprising 33.8% of [Toggles].[COIIDDisplayLabel] speakers.
Households form the common 'economic unit' in our society. Household income is one of the most important indicators of socio-economic status. With other data sources, such as Qualifications and Occupation, it helps to reveal City of Manningham's socio-economic status and economic opportunities for the non-English speaking population.
Household income levels are not comparable over time because of the influences of economic change such as wage level fluctuations and inflation. The income quartile method is a powerful and objective way of looking at income data and in particular, how it is changing. Analysis is simpler due to the breakdown into four simple groups. Quartiles are defined as each containing 25% of all households in Victoria. This topic shows the proportion of the non-English speaking population falling into these four groups which contain an equal number of households at the state level, but may contain different numbers of people. The comparison is shown for people in the selected benchmark.
A detailed explanation of how Household income quartiles are calculated and interpreted is available in specific data notes.
Derived from the Census question:
'What is the total of all wages/salaries, government benefits, pensions, allowances and other income the person usually receives?'
People speaking [COIIDLabelForLanguage] at home, counted in private dwellings
| Household income quartiles | ||||||||
|---|---|---|---|---|---|---|---|---|
| City of Manningham - [Toggles].[COIIDDisplayLabel] | 2021 | 2016 | Change | |||||
| Quartile group | Number | % | Australia | Number | % | Australia | 2016 to 2021 | |
| Lowest group | 10,399 | 19.3 | 15.7 | 921 | 8,444 | 19.1 | 18.7 | +1,955 |
| Medium lowest | 11,612 | 21.5 | 22.9 | 922 | 9,493 | 21.5 | 23.9 | +2,118 |
| Medium highest | 13,701 | 25.4 | 29.8 | 923 | 11,335 | 25.7 | 28.3 | +2,366 |
| Highest group | 18,260 | 33.8 | 31.6 | 924 | 14,864 | 33.7 | 29.2 | +3,396 |
| Total people | 53,974 | 100.0 | 100.0 | 44,138 | 100.0 | 100.0 | +9,836 | |
Source: Australian Bureau of Statistics, Census of Population and Housing (opens a new window) 2016 and 2021. Compiled and presented by .id (opens a new window)(informed decisions).
| Household income - Quartile group dollar ranges | |||||
|---|---|---|---|---|---|
| Calculated from income data for Victoria | Weekly income by Census year | ||||
| Household income ranges | 2021 | 2016 | 2011 | ||
| Lowest group | $0 to $881 | $0 to $740 | $0 to $624 | ||
| Medium lowest | $882 to $1,756 | $741 to $1,416 | $625 to $1,213 | ||
| Medium highest | $1,757 to $2,946 | $1,417 to $2,394 | $1,214 to $2,148 | ||
| Highest group | $2,947 and over | $2,395 and over | $2,149 and over | ||
Compiled and presented by .id (informed decisions).
Compiled and presented by .id (informed decisions).
Dominant groups
Income quartiles allow us to compare relative income-earning capabilities across time. Analysis of the distribution of [Toggles].[COIIDDisplayLabel] speakers in households by household income quartile in City of Manningham compared to Australia shows that there was greater proportion of people in households in the highest income quartile, as well as a greater proportion in the lowest income quartile.
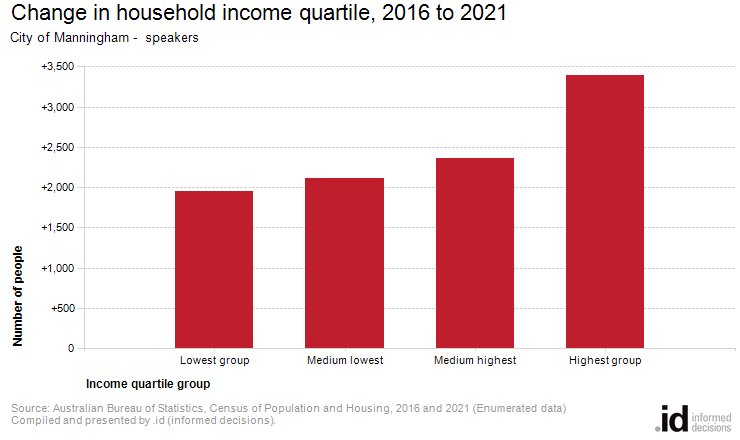
Emerging groups
The most significant change in City of Manningham between 2016 and 2021 for [Toggles].[COIIDDisplayLabel] speakers was in the highest quartile which showed an increase of 3,396 persons.