City of Manningham
Need for assistance - Employment status
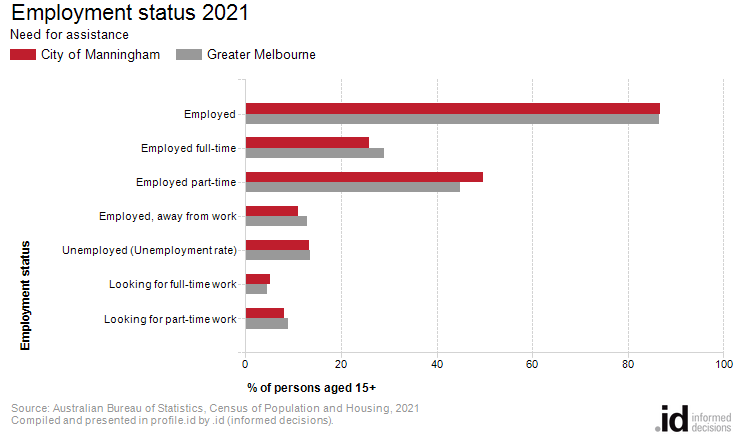
In 2021, 469 people who needed assistance in City of Manningham were employed, of which 29.9% were working full time and 57.4% part time.
City of Manningham's employment statistics are an important indicator of socio-economic status. The levels of full or part-time employment, unemployment and labour force participation indicate the strength of the local economy and social characteristics of the population.
Employment status for those with a need for assistance due to age or disability can provide insight into the participation of those with a disability in the labour market, the likely need for social support services, and the success of employment programs.
To continue building the story of the population with a need for assistance in City of Manningham, employment status should be looked at in conjunction with Age Structure and Qualification datasets.
Derived from the Census question:
'Last week did the person have a full time or part time job of any kind?'
People with a need for assistance aged 15 years and over.
| Employment status | ||||||||
|---|---|---|---|---|---|---|---|---|
| City of Manningham - Need for assistance | 2021 | 2011 | Change | |||||
| Employment status | Number | % | Greater Melbourne | Number | % | Greater Melbourne | 2011 to 2021 | |
| Employed | 469 | 86.7 | 86.6 | 259 | 89.0 | 86.9 | +210 | 13000 |
| Employed full-time | 140 | 25.9 | 28.9 | 80 | 27.5 | 27.9 | +60 | 13001 |
| Employed part-time | 269 | 49.7 | 44.8 | 132 | 45.4 | 44.5 | +137 | 13002 |
| Employed, away from work | 60 | 11.1 | 12.8 | 47 | 16.2 | 14.5 | +13 | 13003 |
| Unemployed (Unemployment rate) | 72 | 13.3 | 13.4 | 32 | 11.0 | 13.1 | +40 | 13004 |
| Looking for full-time work | 28 | 5.2 | 4.6 | 17 | 5.8 | 5.1 | +11 | 13005 |
| Looking for part-time work | 44 | 8.1 | 8.8 | 15 | 5.2 | 8.1 | +29 | 13006 |
| Total Labour force | 541 | 100.0 | 100.0 | 291 | 100.0 | 100.0 | +250 | |
Source: Australian Bureau of Statistics, Census of Population and Housing (opens a new window) 2011 and 2021. Compiled and presented by .id (opens a new window)(informed decisions).
| Labour force status | ||||||||
|---|---|---|---|---|---|---|---|---|
| City of Manningham - Need for assistance | 2021 | 2011 | Change | |||||
| Labour force status | Number | % | Greater Melbourne | Number | % | Greater Melbourne | 2011 to 2021 | |
| Total labour force (Participation rate) | 541 | 7.4 | 9.9 | 291 | 6.2 | 7.2 | +250 | 13500 |
| Not in the labour force | 6,619 | 91.1 | 87.8 | 4,002 | 85.1 | 88.0 | +2,617 | 13501 |
| Labour force status not stated | 109 | 1.5 | 2.3 | 410 | 8.7 | 4.9 | -301 | 13502 |
| Total persons aged 15+ | 7,269 | 100.0 | 100.0 | 4,703 | 100.0 | 100.0 | +2,566 | |
Source: Australian Bureau of Statistics, Census of Population and Housing (opens a new window) 2011 and 2021. Compiled and presented by .id (opens a new window)(informed decisions).
Compiled and presented in profile.id by .id (informed decisions).

Compiled and presented in profile.id by .id (informed decisions).
Dominant groups
The size of City of Manningham's labour force needing assistance in 2021 was 541, of which 269 were employed part-time and 140 were full time workers.
Analysis of the employment status of people needing assistance (as a percentage of the labour force) in City of Manningham in 2021 compared to Greater Melbourne shows that there was a similar proportion in employment, as well as a similar proportion unemployed. Overall, 86.7% of the labour force needing assistance was employed, and 13.3% unemployed, compared with 86.6% and 13.4% respectively for Greater Melbourne.
The labour force participation rate refers to the proportion of the population over 15 years of age that was employed or actively looking for work.
Analysis of the labour force participation rate of the population needing assistance in City of Manningham in 2021 shows that there was a lower proportion in the labour force (7.4%) compared with Greater Melbourne (9.9%).
Emerging groups
Between 2011 and 2021, the number of people needing assistance employed in City of Manningham showed an increase of 210, and the number unemployed showed an increase of 40. In the same period, the number of people needing assistance in the labour force showed an increase of 250 or 85.9%.