City of Manningham
Age groups - Education institution attending
In 2016, 34.6% of City of Manningham's population aged [Parameter].[COIIDLabel] attended an educational institution.
The share of particular age groups attending education is a particularly important socio-economic characteristic, when applied to age groups under 25.
Typically, the ages at which people are likely to attend particular education is as follows:
- 0 to 5 - pre-school
- 5 to 11 - primary school
- 12 to 17 - secondary school
- 18 to 24 - TAFE and university
- 25 or older - mature age students
Significantly lower rates of school attendance among those age groups to which it usually applies can indicate a high school dropout rate, while high rates can indicate the presence of major schools in the area. For tertiary education, this is particularly affected by proximity to universities, and some areas may have close to 100% of their 18-24 year olds in university education, indicating an area catering for students in particular. A low rate may mean a loss of young people who move elsewhere for education.
Derived from the Census question:
'What type of educational institution is the person attending?'
Children aged [Parameter].[COIIDLabel]
| Education institution attending | ||||||||
|---|---|---|---|---|---|---|---|---|
| City of Manningham - [Parameter].[COIIDLabel] | 2016 | 2011 | Change | |||||
| Type of institution | Number | % | [Toggles].[BMACOIIDDisplayLabel] | Number | % | [Toggles].[BMACOIIDDisplayLabel] | 2011 to 2016 | |
| Pre-school | 1,791 | 32.2 | 2.2 | 1,369 | 25.4 | 1.7 | +422 | 7001 |
| Primary school | 0 | 0.0 | 8.1 | 59 | 1.1 | 7.6 | -59 | 7002 |
| Secondary school | 0 | 0.0 | 6.4 | 0 | 0.0 | 6.3 | 0 | 7006 |
| TAFE/Vocational | 0 | 0.0 | 2.5 | 0 | 0.0 | 2.2 | 0 | 7010 |
| University | 0 | 0.0 | 5.8 | 0 | 0.0 | 5.3 | 0 | 7011 |
| Other | 129 | 2.3 | 1.2 | 7 | 0.1 | 1.0 | +122 | 7012 |
| Not attending | 3,539 | 63.7 | 69.2 | 3,860 | 71.5 | 69.2 | -321 | 7013 |
| Not stated | 96 | 1.7 | 4.7 | 105 | 1.9 | 6.6 | -9 | 7014 |
| Total people | 5,555 | 100.0 | 100.0 | 5,400 | 100.0 | 100.0 | +155 | |
Source: Australian Bureau of Statistics, Census of Population and Housing (opens a new window) 2011 and 2016. Compiled and presented by .id (opens a new window)(informed decisions).

Dominant groups
Analysis of the population aged [Parameter].[COIIDLabel] attending educational institutions in City of Manningham in 2016 compared to [Parameter].[BMACOIIDLabel] shows that there was a higher proportion attending pre-school school, a lower proportion attending primary school, and a lower proportion not engaged in any education.
Overall, 32.2412% of the population aged [Parameter].[COIIDLabel] were attending pre-school, % were attending primary institutions, and 63.7084% were not engaged in any education, compared with 2.192%, 8.0739% and 69.1929% respectively for [Parameter].[BMACOIIDLabel].
The major differences between the share of children aged [Parameter].[COIIDLabel] attending learning institutions in City of Manningham and [Parameter].[BMACOIIDLabel] were:
- A larger percentage of people attending pre-school (32.2% compared to 2.2%)
- A smaller percentage of people attending primary school (0.0% compared to 8.1%)
- A smaller percentage of people attending a secondary school (0.0% compared to 6.4%)
- A smaller percentage of people University (0.0% compared to 5.8%)
Emerging groups
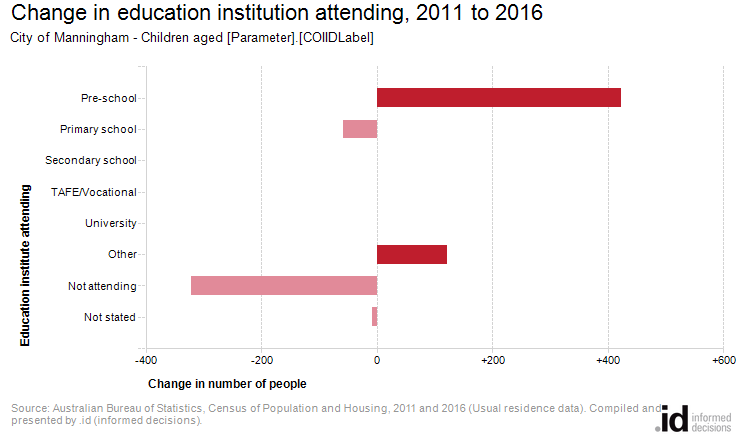
From 2011 to 2016, City of Manningham's population aged [Parameter].[COIIDLabel] increased by 155 people (+2.9%). This represents an average annual change of 0.28% per year over the period.
The largest changes in the number of children aged [Parameter].[COIIDLabel] attending education institutions in City of Manningham, between 2011 and 2016 were:
- Pre-school (+422 persons)
- Other (+122 persons)
- Primary school (-59 persons)