East Brisbane Water District
Unpaid care
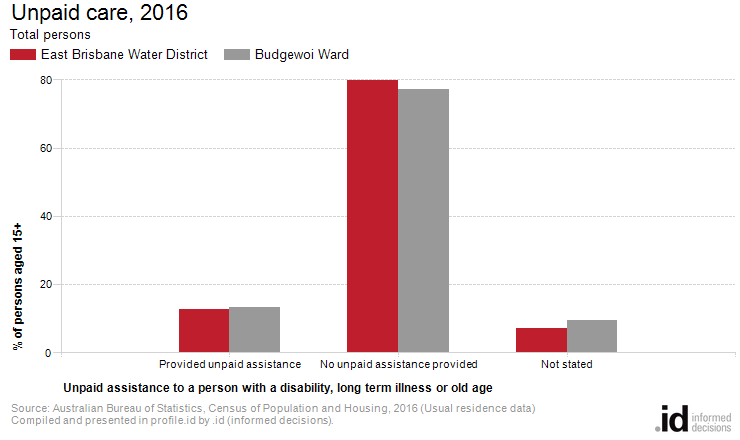
In East Brisbane Water District, 3,173 carers were providing unpaid assistance to a person with a disability, long term illness or old age in 2016. This represents 12.8% of the population aged 15+.
The proportion of people providing unpaid care for the aged and disabled in East Brisbane Water District can be an important indicator of the level of demand for aged care services and facilities by local and state governments. An increasing proportion of carers among the population may indicate inadequate aged care provision, or the need for in-home support, or support for the carers themselves. The level of care provided by individuals is likely to be affected by Household Income, Age Structure and the ethnic makeup of the community (Language Spoken), as well as the sense of community cohesiveness.
Derived from the Census question:
'In the last two weeks did the person spend time providing unpaid care, help or assistance to family members or others because of a disability, a long term illness or problems related to old age?'.
Persons aged 15 years and over.
| Unpaid care | ||||||||
|---|---|---|---|---|---|---|---|---|
| East Brisbane Water District - Persons aged 15+ (Usual residence) | 2016 | 2011 | Change | |||||
| Assistance to a person with a disability, long term illness or old age | Number | % | Budgewoi Ward % | Number | % | Budgewoi Ward % | 2011 to 2016 | |
| 3,173 | 12.8 | 13.3 | 2,977 | 12.5 | 12.7 | +196 | 11001 | |
| No unpaid assistance provided | 19,769 | 80.0 | 77.3 | 19,131 | 80.1 | 78.4 | +637 | 11002 |
| Not stated | 1,784 | 7.2 | 9.4 | 1,774 | 7.4 | 8.9 | +10 | 11003 |
| Total persons aged 15+ | 24,726 | 100.0 | 100.0 | 23,883 | 100.0 | 100.0 | +843 | |
Source: Australian Bureau of Statistics, Census of Population and Housing (opens a new window) 2011 and 2016. Compiled and presented by .id (opens a new window)(informed decisions).
Compiled and presented in profile.id by .id (informed decisions).
Compiled and presented in profile.id by .id (informed decisions).
Dominant groups
Analysis of the unpaid care provided by the population in East Brisbane Water District in 2016 compared to Budgewoi Ward shows that there was a similar proportion of people who provided unpaid care either to family members or others.
Overall, 12.8% of the population provided unpaid care, compared with 13.3% for Budgewoi Ward.
Emerging groups
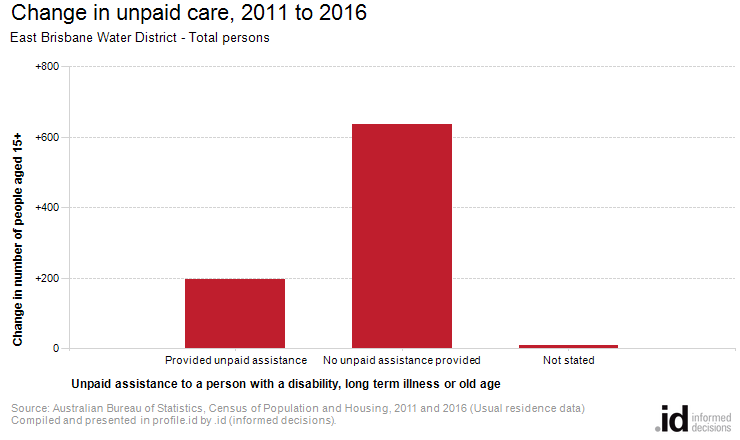
The number of people who provided unpaid assistance to a person with a disability, long term illness or old age in East Brisbane Water District increased by 196 between 2011 and 2016.