Central Coast Council area
Overseas born - Language spoken at home
In 2021, 80.2% of the population [Toggles].[COIIDDisplayLabel] in Central Coast Council area, spoke a language other than English at home.
Central Coast Council area's language statistics show the proportion of the overseas-born population who speak a language at home other than English. They indicate how linguistically diverse a population is, and whether most migrants are from English speaking countries or non-English speaking countries. This topic also shows those languages spoken specifically by the first-generation migrants (those born overseas) so as to separate them from those born in Australia who speak another language.
Some countries, such as India, have a variety of languages spoken there, so the language spoken can indicate the region of the country of origin. Languages such as Arabic and Spanish are spoken in a range of different countries.
Central Coast Council area's language statistics should be analysed in conjunction with Proficiency in English to assist in identifying specific cultural and ethnic groups in the area and the services required by the multicultural community.
Derived from the Census question:
'Does the person use a language other than English at home?'
People [Toggles].[COIIDDisplayLabel]
| Language spoken at home - Ranked by size | ||||||||
|---|---|---|---|---|---|---|---|---|
| Central Coast Council area - [Toggles].[COIIDDisplayLabel] | 2021 | 2011 | Change | |||||
| Language | Number | % | Central Coast Council area - Total population | Number | % | Central Coast Council area - Total population | 2011 to 2021 | |
| Malayalam | 562 | 23.8 | 23.8 | 30141 | 33 | 4.2 | 4.2 | +529 |
| Punjabi | 474 | 20.1 | 20.1 | 30198 | 75 | 9.6 | 9.6 | +399 |
| Hindi | 336 | 14.2 | 14.2 | 30088 | 118 | 15.2 | 15.2 | +218 |
| Telugu | 117 | 5.0 | 5.0 | 30237 | 30 | 3.9 | 3.9 | +87 |
| Tamil | 104 | 4.4 | 4.4 | 30235 | 51 | 6.6 | 6.6 | +53 |
| Gujarati | 89 | 3.8 | 3.8 | 30081 | 37 | 4.8 | 4.8 | +52 |
| Marathi | 53 | 2.2 | 2.2 | 30149 | 39 | 5.0 | 5.0 | +14 |
| Urdu | 35 | 1.5 | 1.5 | 30257 | 9 | 1.2 | 1.2 | +26 |
| Tibetan | 29 | 1.2 | 1.2 | 30241 | -- | 0.0 | 0.0 | -- |
| Kannada | 20 | 0.8 | 0.8 | 30111 | 9 | 1.2 | 1.2 | +11 |
| Southern Asian Languages, nfd | 18 | 0.8 | 0.8 | 30224 | 16 | 2.1 | 2.1 | +2 |
| Bengali | 17 | 0.7 | 0.7 | 30026 | -- | 0.0 | 0.0 | -- |
| Konkani | 15 | 0.6 | 0.6 | 30120 | 8 | 1.0 | 1.0 | +7 |
| Show me more! | ||||||||
Source: Australian Bureau of Statistics, Census of Population and Housing (opens a new window) 2011 and 2021. Compiled and presented by .id (opens a new window)(informed decisions).
Excludes languages with fewer than 10 people speaking them at home.
| Language spoken at home - Summary | ||||||||
|---|---|---|---|---|---|---|---|---|
| Central Coast Council area - [Toggles].[COIIDDisplayLabel] | 2021 | 2011 | Change | |||||
| Language summary | Number | % | Central Coast Council area - Total population | Number | % | Central Coast Council area - Total population | 2011 to 2021 | |
| Speaks English only | 456 | 19.3 | 19.3 | 60500 | 316 | 40.6 | 40.6 | +140 |
| Non-English total | 1,894 | 80.2 | 80.2 | 60510 | 459 | 59.0 | 59.0 | +1,435 |
| Not stated | 12 | 0.5 | 0.5 | 60520 | 3 | 0.4 | 0.4 | +9 |
| Total people | 2,362 | 100.0 | 100.0 | 778 | 100.0 | 100.0 | +1,584 | |
Source: Australian Bureau of Statistics, Census of Population and Housing (opens a new window) 2011 and 2021. Compiled and presented by .id (opens a new window)(informed decisions).

Compiled and presented in profile.id by .id (informed decisions).
Compiled and presented in profile.id by .id (informed decisions).
Dominant groups
Analysis of the language spoken at home by the population [Toggles].[COIIDDisplayLabel] in Central Coast Council area in 2021 compared to the total population shows that there was a similar proportion of people who spoke English only, as well as a similar proportion of those speaking a non-English language (either exclusively, or in addition to English).
Overall, 19.3% of the population [Toggles].[COIIDDisplayLabel] spoke English only, and 80.2% spoke a non-English language, compared with 19.3% and 80.2% respectively for the total population.
The dominant language spoken at home by the population [Toggles].[COIIDDisplayLabel], other than English, in Central Coast Council area was Malayalam, with 23.8% of the population, or 562 people speaking this language at home.
There were no major differences between the population [Toggles].[COIIDDisplayLabel] in Central Coast Council area and the total population in 2021.
Emerging groups
Between 2011 and 2021, the number of the population [Toggles].[COIIDDisplayLabel] who spoke a language other than English at home increased by 1,435 or 312.6%, and the number of people who spoke English only increased by 140 or 44.3%.
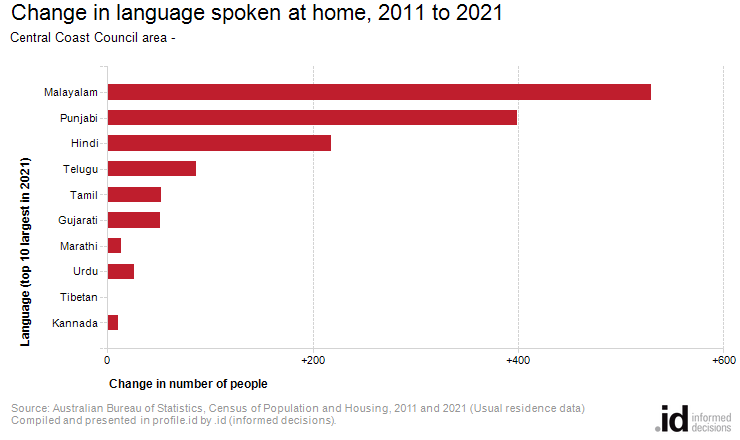
The largest changes in the spoken languages of the population in Central Coast Council area between 2011 and 2021 were for those speaking:
- Malayalam (+529 persons)
- Punjabi (+399 persons)
- Hindi (+218 persons)
- Telugu (+87 persons)