Central Coast Council area
Non-English speakers - Dwelling type
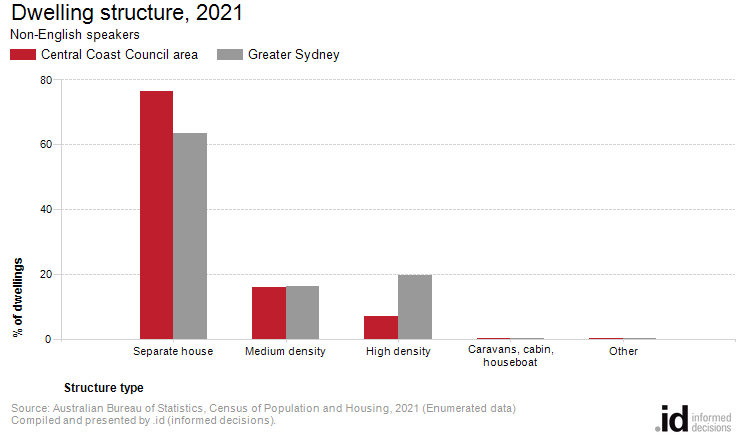
In Central Coast Council area, 22.8% of [Toggles].[COIIDDisplayLabel] speakers were living in medium or high density dwellings.
Dwelling Type is an important determinant of Central Coast Council area's residential role and function. A greater concentration of higher density dwellings may attract young people and more residents born in particular countries where high density housing is more prevalent.
For non-English speaking populations, this topic can look at the differences in the type of housing occupied by different communities within your area. High density housing may provide affordable rental or home ownership opportunities to new migrants, or a particular older community may have lived in an area long term, but changing housing stock could create issues for this community.
Dwelling Type statistics are closely related to the Housing Tenure and Household Type of the non-English speaking communities in Central Coast Council area.
Derived from the Census:
'Dwelling Structure is derived from the ABS address register supplemented with information from Census Field Officers.'
People using [COIIDLabelForLanguage] at home, counted in dwellings
| Dwelling structure | ||||||||
|---|---|---|---|---|---|---|---|---|
| Central Coast Council area - Non-English speakers | 2021 | 2016 | Change | |||||
| Dwelling type | Number | % | Greater Sydney | Number | % | Greater Sydney | 2016 to 2021 | |
| Separate house | 18,740 | 76.5 | 63.6 | 14,243 | 75.7 | 63.5 | +4,497 | 27001 |
| Medium density | 3,881 | 15.8 | 16.3 | 3,308 | 17.6 | 17.7 | +573 | 27002 |
| High density | 1,702 | 6.9 | 19.5 | 1,044 | 5.6 | 17.9 | +658 | 27003 |
| Caravans, cabin, houseboat | 57 | 0.2 | 0.1 | 90 | 0.5 | 0.1 | -33 | 27004 |
| Other | 36 | 0.1 | 0.3 | 54 | 0.3 | 0.4 | -18 | 27005 |
| Not stated | 82 | 0.3 | 0.2 | 71 | 0.4 | 0.4 | +11 | 27006 |
| Total people counted in occupied private dwellings | 24,498 | 100.0 | 100.0 | 18,810 | 100.0 | 100.0 | +5,688 | |
Source: Australian Bureau of Statistics, Census of Population and Housing (opens a new window) 2016 and 2021. Compiled and presented by .id (opens a new window)(informed decisions).
| Dwelling type | ||||||||
|---|---|---|---|---|---|---|---|---|
| Central Coast Council area - Non-English speakers | 2021 | 2016 | Change | |||||
| Dwelling type | Number | % | Greater Sydney | Number | % | Greater Sydney | 2016 to 2021 | |
| Occupied private dwellings | 24,498 | 99.1 | 98.2 | 18,810 | 98.5 | 97.3 | +5,688 | 27500 |
| Non private dwellings | 223 | 0.9 | 1.8 | 277 | 1.5 | 2.7 | -54 | 27502 |
| Total people counted in occupied dwellings | 24,721 | 100.0 | 100.0 | 19,087 | 100.0 | 100.0 | +5,634 | |
Source: Australian Bureau of Statistics, Census of Population and Housing (opens a new window) 2016 and 2021. Compiled and presented by .id (opens a new window)(informed decisions).
Compiled and presented by .id (informed decisions).
Compiled and presented by .id (informed decisions).
Dominant groups
Analysis of the types of dwellings for [Toggles].[COIIDDisplayLabel] speakers in Central Coast Council area in 2021 shows that 76.5% of [Toggles].[COIIDDisplayLabel] speakers were living in separate houses; 15.8% were medium density dwellings, and 6.9% were high density dwellings, compared with 63.6%, 16.3%, and 19.5% in Greater Sydney respectively.
Emerging groups
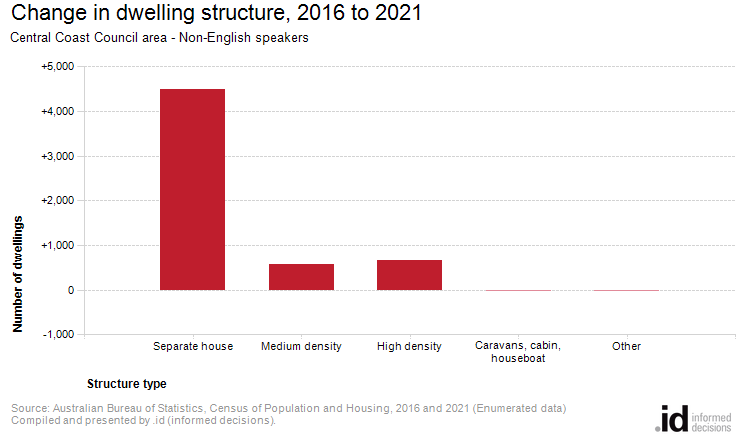
The total number of [Toggles].[COIIDDisplayLabel] speakers in occupied private dwellings in Central Coast Council area increased by 5,688 between 2016 and 2021.
The largest changes in the type of dwellings for [Toggles].[COIIDDisplayLabel] speakers in Central Coast Council area between 2016 and 2021 were:
- Separate house (+4,497 persons)
- High density (+658 persons)
- Medium density (+573 persons)