Central Coast Council area
Non-English speakers - Assistance & disability
In 2021, 53 people or 7.2% of the [Toggles].[COIIDDisplayLabel] speaking population in Central Coast Council area, reported needing help in their day-to-day lives due to disability.
Central Coast Council area's disability statistics relate directly to need for assistance due to a severe or profound disability. The information may be used in the planning of local facilities, services such as day-care and occasional care and in the provision of information and support to carers. Central Coast Council area's non-English speakers disability statistics help in understanding the prevalence of people who need support in the community, and along with information on Unpaid Care to a person with a disability, how that support is provided.
Differences in this topic between non-English speakers and total population may be related to age, or other factors.
Please note: Auslan and other sign languages are regarded as languages other than English and so speakers of those languages will be included in this topic.
Please note: A person's reported need for assistance is based on a subjective assessment and should therefore be treated with caution. See the specific data notes for further detail.
Derived from the Census questions:
'Does the person ever need someone to help with, or be with them for, self care activities?', 'Does the person ever need someone to help with, or be with them for, body movement activities?', 'Does the person ever need someone to help with, or be with them for, communication activities?', and 'What are the reasons for the need for assistance or supervision shown in questions 20, 21 and 22?' (as per above).
People speaking [COIIDLabelForLanguage] at home
| Need for assistance with core activities by age | ||||||||
|---|---|---|---|---|---|---|---|---|
| Central Coast Council area - [Toggles].[COIIDDisplayLabel] | 2021 | 2011 | Change | |||||
| Assistance needed by age group (years) | Number | % | Greater Sydney | Number | % | Greater Sydney | 2011 to 2021 | |
| 0-17 years | 0 | 0.0 | 6.0 | 0 | 0.0 | 7.6 | 0 | 10 |
| 18-64 years | 19 | 35.8 | 43.7 | 18 | 69.2 | 55.4 | +1 | 20 |
| 65 years and over | 34 | 64.2 | 50.3 | 8 | 30.8 | 37.0 | +26 | 30 |
| Total people needing assistance | 53 | 100.0 | 100.0 | 26 | 100.0 | 100.0 | +27 | |
Source: Australian Bureau of Statistics, Census of Population and Housing (opens a new window) 2011 and 2021. Compiled and presented by .id (opens a new window)(informed decisions).
| Need for assistance with core activities summary | ||||||||
|---|---|---|---|---|---|---|---|---|
| Central Coast Council area - [Toggles].[COIIDDisplayLabel] | 2021 | 2011 | Change | |||||
| Assistance needed | Number | % | Greater Sydney | Number | % | Greater Sydney | 2011 to 2021 | |
| Total persons needing assistance | 53 | 7.2 | 10.0 | 26 | 5.4 | 8.0 | +27 | 1 |
| Total persons not needing assistance | 681 | 92.3 | 88.6 | 447 | 93.5 | 89.6 | +234 | 2 |
| Not stated | 4 | 0.5 | 1.4 | 5 | 1.0 | 2.4 | -1 | 3 |
| Total people | 738 | 100.0 | 100.0 | 478 | 100.0 | 100.0 | +260 | |
Source: Australian Bureau of Statistics, Census of Population and Housing (opens a new window) 2011 and 2021. Compiled and presented by .id (opens a new window)(informed decisions).
Compiled and presented in profile.id by .id (informed decisions).
Compiled and presented in profile.id by .id (informed decisions).
Dominant groups
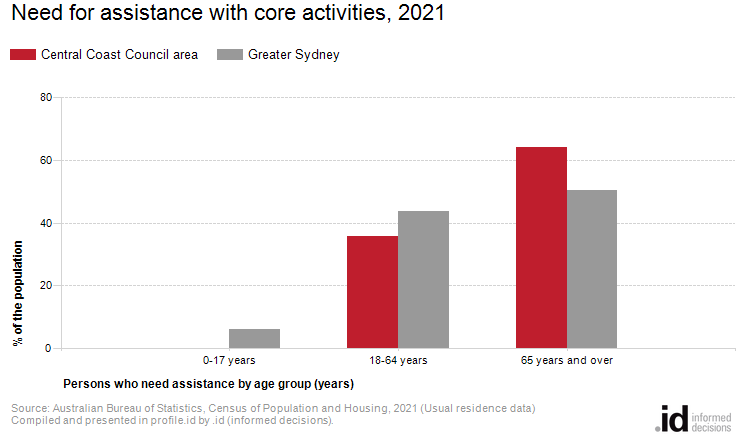
Analysis of the need for assistance for the [Toggles].[COIIDDisplayLabel] population in Central Coast Council area compared to Greater Sydney shows that there was a similar proportion of people who reported needing assistance with core activities.
Overall, 7.2% of the [Toggles].[COIIDDisplayLabel] population reported needing assistance with core activities, compared with 10.0% for Greater Sydney.
The major differences between the age groups of the [Toggles].[COIIDDisplayLabel] speaking population reporting a need for assistance in Central Coast Council area and Greater Sydney needing assistance were:
- A larger percentage of people aged 65 years and over (64.2% compared to 50.3%)
- A smaller percentage of people aged 18-64 years (35.8% compared to 43.7%)
- A smaller percentage of people aged 0-17 years (0.0% compared to 6.0%)
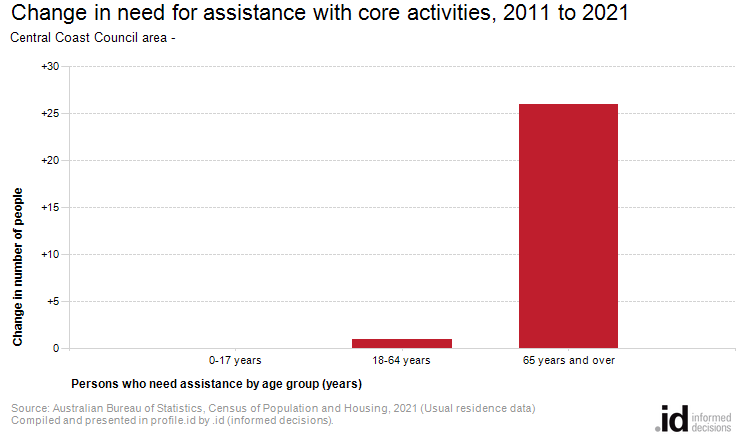
Emerging groups
There were no major changes for Central Coast Council area between 2011 and 2021.