East Brisbane Water District
Individual income quartiles
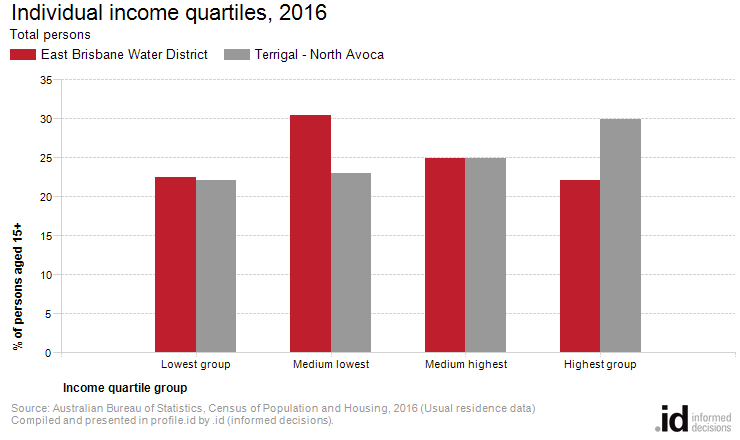
In East Brisbane Water District, the 'medium lowest' income quartile was the largest group in 2016, comprising 30% of people aged 15 and over.
East Brisbane Water District's income statistics are an indicator of socio-economic status. With other data sources, such as Household Income, Qualifications and Occupation, they help tell the story of the area's economic opportunities and socio-economic status. Individual income levels are not comparable over time because of the influences of economic change such as wage level fluctuations and inflation. The income quartile method is the most objective method of comparing change in the income profile of a community over time.
A detailed explanation of how Individual Income quartiles are calculated and interpreted is available in specific data notes.
Derived from the Census question:
'What is the total of all wages/salaries, government benefits, pensions, allowances and other income the person usually receives?'
Gross amount for persons aged 15 years and over
| Individual income quartiles | ||||||||
|---|---|---|---|---|---|---|---|---|
| East Brisbane Water District - Persons aged 15+ (Usual residence) | 2016 | 2011 | Change | |||||
| Quartile group | Number | % | Terrigal - North Avoca % | Number | % | Terrigal - North Avoca % | 2011 to 2016 | |
| Lowest group | 5,181 | 22.5 | 22.1 | 5,246 | 23.4 | 22.3 | -64 | 30001 |
| Medium lowest | 6,988 | 30.4 | 23.0 | 6,768 | 30.1 | 22.4 | +221 | 30002 |
| Medium highest | 5,731 | 24.9 | 25.0 | 5,647 | 25.2 | 26.0 | +84 | 30003 |
| Highest group | 5,089 | 22.1 | 29.9 | 4,789 | 21.3 | 29.3 | +300 | 30004 |
| Total persons aged 15+ | 22,992 | 100.0 | 100.0 | 22,451 | 100.0 | 100.0 | +541 | |
Source: Australian Bureau of Statistics, Census of Population and Housing (opens a new window) 2011 and 2016. Compiled and presented by .id (opens a new window)(informed decisions).
(Usual residence data)
| Individual income - Quartile group dollar ranges | |||||
|---|---|---|---|---|---|
| Calculated from income data for [theQBMQuartile] - Total persons aged 15+ | Weekly income by Census year | ||||
| Individual quartile ranges | 2021 | 2016 | 2011 | 2006 | 2001 |
| Lowest group | $0 to $384 | $0 to $324 | $0 to $266 | $0 to $207 | $0 to $183 |
| Medium lowest | $385 to $813 | $325 to $663 | $267 to $560 | $208 to $460 | $184 to $386 |
| Medium highest | $814 to $1,520 | $664 to $1,244 | $561 to $1,093 | $461 to $895 | $387 to $719 |
| Highest group | $1,521 and over | $1,245 and over | $1,094 and over | $896 and over | $720 and over |
Compiled and presented in profile.id by .id (informed decisions).
Compiled and presented in profile.id by .id (informed decisions).
Dominant groups
Income quartiles allow us to compare relative income-earning capabilities across time. Analysis of the distribution of the population by income quartile in East Brisbane Water District compared to Terrigal - North Avoca shows that there was lesser proportion of persons in the highest income quartile and a similar proportion in the lowest income quartile.
Emerging groups
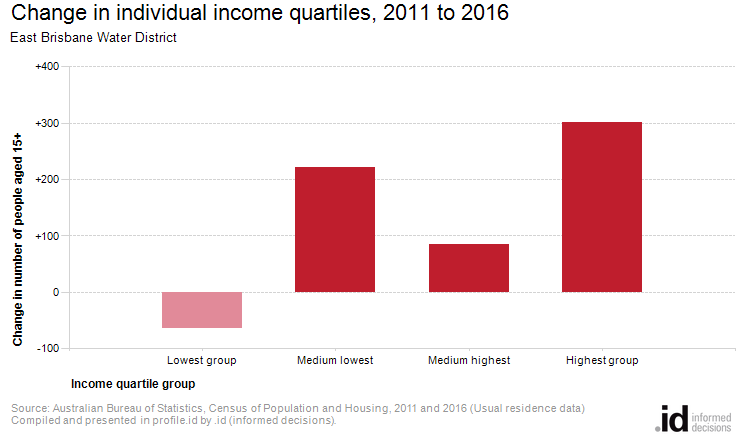
The most significant change in East Brisbane Water District in persons between 2011 and 2016 was in the highest quartile which showed an increase of 300 persons.