Central Coast Council area
Birthplace
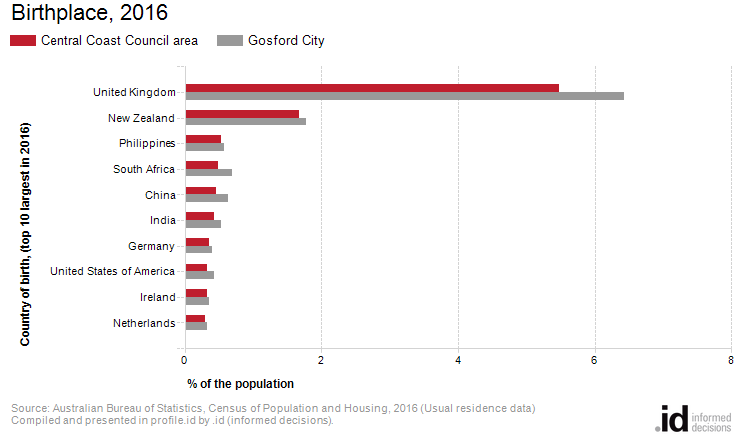
In 2016, 14.6% of people in Central Coast Council area were born overseas, compared with 17.2% in Gosford City.
Country of Birth data identifies where people were born and is indicative of the level of cultural diversity in Central Coast Council area. The mix of Country of Birth groups is also indicative of historical settlement patterns, as source countries for Australia's immigration program have varied significantly over time.
To get a more complete picture of cultural and ethnic characteristics, Central Coast Council area's Country of Birth data should be viewed together with Ancestry, Language Spoken at Home and Religion.
Please note: Due to changes in ABS rules around perturbation and additivity of data to protect the confidentiality of individuals, counts of individual birthplace groups and totals derived from them may differ slightly from those published by the ABS. For more information see notes on data confidentiality.
Derived from the Census question:
'In which country was the person born?'
Total population
| Birthplace - Summary | ||||||||
|---|---|---|---|---|---|---|---|---|
| Central Coast Council area - Total persons (Usual residence) | 2016 | 2011 | Change | |||||
| Birthplace | Number | % | Gosford City % | Number | % | Gosford City % | 2011 to 2016 | |
| Total overseas born | 47,951 | 14.6 | 17.2 | 38000 | 43,649 | 14.0 | 15.8 | +4,302 |
| Australia | 258,369 | 78.8 | 76.5 | 38004 | 251,644 | 80.6 | 78.5 | +6,725 |
| Not stated | 21,412 | 6.5 | 6.3 | 38006 | 16,893 | 5.4 | 5.7 | +4,519 |
| Total Population | 327,732 | 100.0 | 100.0 | 312,186 | 100.0 | 100.0 | +15,546 | |
Source: Australian Bureau of Statistics, Census of Population and Housing (opens a new window) 2011 and 2016. Compiled and presented by .id (opens a new window)(informed decisions).
| Birthplace - Ranked by size | ||||||||
|---|---|---|---|---|---|---|---|---|
| Central Coast Council area - Overseas born (Usual residence) | 2016 | 2011 | Change | |||||
| Birthplace | Number | % | Gosford City % | Number | % | Gosford City % | 2011 to 2016 | |
| United Kingdom | 17,976 | 5.5 | 6.4 | 30036 | 18,094 | 5.8 | 6.6 | -118 |
| New Zealand | 5,506 | 1.7 | 1.8 | 30023 | 5,412 | 1.7 | 1.8 | +94 |
| Philippines | 1,752 | 0.5 | 0.6 | 30027 | 1,280 | 0.4 | 0.4 | +472 |
| South Africa | 1,612 | 0.5 | 0.7 | 30031 | 1,371 | 0.4 | 0.6 | +241 |
| China | 1,498 | 0.5 | 0.6 | 30005 | 913 | 0.3 | 0.4 | +585 |
| India | 1,393 | 0.4 | 0.5 | 30013 | 770 | 0.2 | 0.3 | +623 |
| Germany | 1,171 | 0.4 | 0.4 | 30010 | 1,184 | 0.4 | 0.4 | -13 |
| United States of America | 1,056 | 0.3 | 0.4 | 30037 | 940 | 0.3 | 0.4 | +116 |
| Ireland | 1,052 | 0.3 | 0.4 | 30016 | 945 | 0.3 | 0.3 | +107 |
| Netherlands | 1,000 | 0.3 | 0.3 | 30022 | 1,118 | 0.4 | 0.4 | -118 |
| Italy | 888 | 0.3 | 0.2 | 30017 | 829 | 0.3 | 0.3 | +59 |
| Malta | 640 | 0.2 | 0.1 | 30021 | 635 | 0.2 | 0.1 | +5 |
| South Korea | 577 | 0.2 | 0.3 | 30029 | 312 | 0.1 | 0.2 | +265 |
| Canada | 562 | 0.2 | 0.2 | 30004 | 513 | 0.2 | 0.2 | +49 |
| Thailand | 560 | 0.2 | 0.2 | 30034 | 356 | 0.1 | 0.1 | +204 |
| Malaysia | 414 | 0.1 | 0.1 | 30020 | 347 | 0.1 | 0.1 | +67 |
| Indonesia | 384 | 0.1 | 0.1 | 30014 | 311 | 0.1 | 0.1 | +73 |
| Fiji | 379 | 0.1 | 0.1 | 30008 | 335 | 0.1 | 0.1 | +44 |
| Egypt | 348 | 0.1 | 0.1 | 30007 | 354 | 0.1 | 0.1 | -6 |
| Poland | 339 | 0.1 | 0.1 | 30028 | 292 | 0.1 | 0.1 | +47 |
| Greece | 332 | 0.1 | 0.1 | 30011 | 317 | 0.1 | 0.1 | +15 |
| Chile | 307 | 0.1 | 0.1 | 30045 | 252 | 0.1 | 0.1 | +55 |
| Papua New Guinea | 303 | 0.1 | 0.1 | 30026 | 243 | 0.1 | 0.1 | +60 |
| Vietnam | 302 | 0.1 | 0.1 | 30038 | 171 | 0.1 | 0.1 | +131 |
| Uruguay | 289 | 0.1 | 0.1 | 30127 | 248 | 0.1 | 0.1 | +41 |
| France | 280 | 0.1 | 0.1 | 30039 | 210 | 0.1 | 0.1 | +70 |
| Zimbabwe | 278 | 0.1 | 0.1 | 30131 | 203 | 0.1 | 0.1 | +75 |
| Japan | 273 | 0.1 | 0.1 | 30018 | 205 | 0.1 | 0.1 | +68 |
| Hong Kong | 266 | 0.1 | 0.1 | 30012 | 244 | 0.1 | 0.1 | +22 |
| Croatia | 266 | 0.1 | 0.1 | 30006 | 257 | 0.1 | 0.1 | +9 |
| Sri Lanka | 239 | 0.1 | 0.1 | 30033 | 168 | 0.1 | 0.1 | +71 |
| Russian Federation | 232 | 0.1 | 0.1 | 30056 | 146 | 0.0 | 0.1 | +86 |
| Serbia / Montenegro (fmr Yugoslavia) | 225 | 0.1 | 0.1 | 30032 | 272 | 0.1 | 0.1 | -47 |
| Austria | 204 | 0.1 | 0.1 | 30042 | 207 | 0.1 | 0.1 | -3 |
| Singapore | 197 | 0.1 | 0.1 | 30030 | 154 | 0.0 | 0.1 | +43 |
| Lebanon | 192 | 0.1 | 0.1 | 30019 | 157 | 0.1 | 0.0 | +35 |
| Hungary | 182 | 0.1 | 0.1 | 30048 | 189 | 0.1 | 0.1 | -7 |
| Argentina | 177 | 0.1 | 0.0 | 30041 | 135 | 0.0 | 0.0 | +42 |
| Denmark | 164 | 0.1 | 0.1 | 30075 | 161 | 0.1 | 0.1 | +3 |
| Spain | 155 | 0.0 | 0.1 | 30057 | 141 | 0.0 | 0.1 | +14 |
| Sweden | 150 | 0.0 | 0.0 | 30119 | 120 | 0.0 | 0.0 | +30 |
| Mauritius | 147 | 0.0 | 0.0 | 30052 | 138 | 0.0 | 0.0 | +9 |
| Brazil | 143 | 0.0 | 0.1 | 30067 | 89 | 0.0 | 0.0 | +54 |
| Pakistan | 137 | 0.0 | 0.0 | 30108 | 79 | 0.0 | 0.0 | +58 |
| Tonga | 134 | 0.0 | 0.0 | 30123 | 120 | 0.0 | 0.0 | +14 |
| Switzerland | 133 | 0.0 | 0.1 | 30120 | 122 | 0.0 | 0.1 | +11 |
| Peru | 126 | 0.0 | 0.1 | 30109 | 87 | 0.0 | 0.0 | +39 |
| Iran | 123 | 0.0 | 0.0 | 30049 | 111 | 0.0 | 0.0 | +12 |
| Portugal | 121 | 0.0 | 0.0 | 30054 | 88 | 0.0 | 0.0 | +33 |
| Taiwan | 116 | 0.0 | 0.1 | 30058 | 51 | 0.0 | 0.0 | +65 |
| Finland | 116 | 0.0 | 0.0 | 30082 | 126 | 0.0 | 0.1 | -10 |
| Czechia | 97 | 0.0 | 0.0 | 30074 | 82 | 0.0 | 0.0 | +15 |
| Colombia | 94 | 0.0 | 0.0 | 30071 | 60 | 0.0 | 0.0 | +34 |
| Ukraine | 92 | 0.0 | 0.0 | 30060 | 61 | 0.0 | 0.0 | +31 |
| Turkey | 90 | 0.0 | 0.0 | 30035 | 83 | 0.0 | 0.0 | +7 |
| Nepal | 89 | 0.0 | 0.0 | 30102 | 22 | 0.0 | 0.0 | +67 |
| Romania | 77 | 0.0 | 0.0 | 30055 | 65 | 0.0 | 0.0 | +12 |
| Kenya | 76 | 0.0 | 0.0 | 30088 | 61 | 0.0 | 0.0 | +15 |
| Cambodia | 74 | 0.0 | 0.0 | 30044 | 50 | 0.0 | 0.0 | +24 |
| Bangladesh | 70 | 0.0 | 0.0 | 30063 | 65 | 0.0 | 0.0 | +5 |
| Bosnia and Herzegovina | 68 | 0.0 | 0.0 | 30003 | 63 | 0.0 | 0.0 | +5 |
| Cyprus | 67 | 0.0 | 0.0 | 30046 | 65 | 0.0 | 0.0 | +2 |
| Belgium | 65 | 0.0 | 0.0 | 30065 | 69 | 0.0 | 0.0 | -4 |
| Eastern Europe, nfd | 63 | 0.0 | 0.0 | 30076 | 51 | 0.0 | 0.0 | +12 |
| Burma (Myanmar) | 62 | 0.0 | 0.0 | 30070 | 47 | 0.0 | 0.0 | +15 |
| Samoa | 62 | 0.0 | 0.0 | 30110 | 49 | 0.0 | 0.0 | +13 |
| Iraq | 58 | 0.0 | 0.0 | 30015 | 60 | 0.0 | 0.0 | -2 |
| Israel | 54 | 0.0 | 0.0 | 30086 | 38 | 0.0 | 0.0 | +16 |
| Slovakia | 54 | 0.0 | 0.0 | 30115 | 45 | 0.0 | 0.0 | +9 |
| Latvia | 54 | 0.0 | 0.0 | 30092 | 73 | 0.0 | 0.0 | -19 |
| Syria | 51 | 0.0 | 0.0 | 30121 | 32 | 0.0 | 0.0 | +19 |
| Norway | 48 | 0.0 | 0.0 | 30105 | 31 | 0.0 | 0.0 | +17 |
| Slovenia | 47 | 0.0 | 0.0 | 30116 | 61 | 0.0 | 0.0 | -14 |
| Zambia | 43 | 0.0 | 0.0 | 30130 | 34 | 0.0 | 0.0 | +9 |
| Nigeria | 41 | 0.0 | 0.0 | 30104 | 33 | 0.0 | 0.0 | +8 |
| North Macedonia | 39 | 0.0 | 0.0 | 30009 | 38 | 0.0 | 0.0 | +1 |
| Laos | 35 | 0.0 | 0.0 | 30091 | 15 | 0.0 | 0.0 | +20 |
| United Arab Emirates | 31 | 0.0 | 0.0 | 30126 | 11 | 0.0 | 0.0 | +20 |
| Cook Islands | 31 | 0.0 | 0.0 | 30073 | 22 | 0.0 | 0.0 | +9 |
| Lithuania | 30 | 0.0 | 0.0 | 30095 | 21 | 0.0 | 0.0 | +9 |
| Ecuador | 26 | 0.0 | 0.0 | 30077 | 23 | 0.0 | 0.0 | +3 |
| El Salvador | 24 | 0.0 | 0.0 | 30078 | 22 | 0.0 | 0.0 | +2 |
| Afghanistan | 24 | 0.0 | 0.0 | 30061 | 18 | 0.0 | 0.0 | +6 |
| Estonia | 23 | 0.0 | 0.0 | 30080 | 22 | 0.0 | 0.0 | +1 |
| Bulgaria | 23 | 0.0 | 0.0 | 30069 | 16 | 0.0 | 0.0 | +7 |
| Mexico | 22 | 0.0 | 0.0 | 30097 | 23 | 0.0 | 0.0 | -1 |
| East Timor | 21 | 0.0 | 0.0 | 30047 | 15 | 0.0 | 0.0 | +6 |
| Morocco | 20 | 0.0 | -- | 30099 | 19 | 0.0 | 0.0 | +1 |
| Saudi Arabia | 19 | 0.0 | 0.0 | 30111 | 12 | 0.0 | 0.0 | +7 |
| Vanuatu | 18 | 0.0 | 0.0 | 30128 | 16 | 0.0 | 0.0 | +2 |
| Belarus | 18 | 0.0 | 0.0 | 30064 | 3 | 0.0 | 0.0 | +15 |
| Jordan | 17 | 0.0 | 0.0 | 30087 | 12 | 0.0 | 0.0 | +5 |
| Tanzania | 17 | 0.0 | 0.0 | 30122 | 21 | 0.0 | 0.0 | -4 |
| Namibia | 17 | 0.0 | 0.0 | 30101 | 9 | 0.0 | 0.0 | +8 |
| Trinidad and Tobago | 16 | 0.0 | 0.0 | 30124 | 14 | 0.0 | 0.0 | +2 |
| Uganda | 14 | 0.0 | -- | 30125 | 19 | 0.0 | 0.0 | -5 |
| Ghana | 14 | 0.0 | 0.0 | 30084 | 13 | 0.0 | 0.0 | +1 |
| Ethiopia | 13 | 0.0 | -- | 30081 | 14 | 0.0 | 0.0 | -1 |
| Sudan | 13 | 0.0 | -- | 30134 | 10 | 0.0 | 0.0 | +3 |
| New Caledonia | 13 | 0.0 | 0.0 | 30103 | 18 | 0.0 | 0.0 | -5 |
| Kuwait | 10 | 0.0 | -- | 30090 | 4 | 0.0 | 0.0 | +6 |
| Botswana | 10 | 0.0 | -- | 30066 | 6 | 0.0 | 0.0 | +4 |
| Albania | 10 | 0.0 | 0.0 | 30062 | 4 | 0.0 | 0.0 | +6 |
| Show me more! | ||||||||
Excludes countries of birth with fewer than 10 people.
Compiled and presented in profile.id by .id (informed decisions).
Compiled and presented in profile.id by .id (informed decisions).
Dominant groups
Analysis of the country of birth of the population in Central Coast Council area in 2016 compared to Gosford City shows that there was a smaller proportion of people born overseas.
Overall, 14.6% of the population was born overseas, compared with 17.2% for Gosford City.
The largest non-English speaking country of birth in Central Coast Council area was Philippines, where 0.5% of the population, or 1,752 people, were born.
There were no major differences between Central Coast Council area and Gosford City in 2016.
Emerging groups
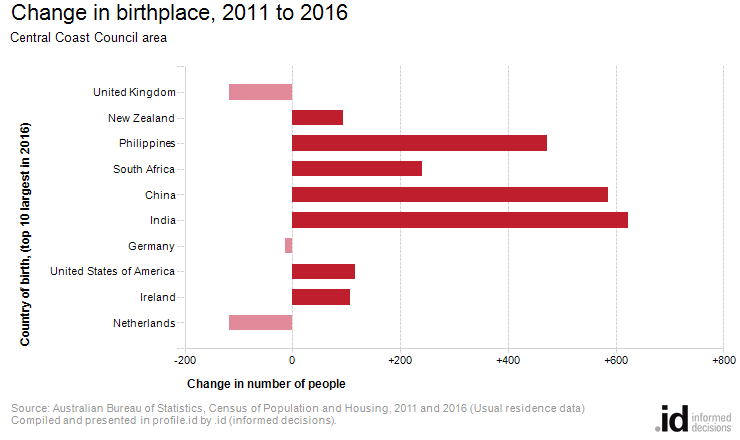
Between 2011 and 2016, the number of people born overseas increased by 4,302 or 9.9%.
The largest changes in birthplace countries of the population in this area between 2011 and 2016 were for those born in:
- India (+623 persons)
- China (+585 persons)
- Philippines (+472 persons)
- South Korea (+265 persons)