Cranbourne
Unpaid childcare
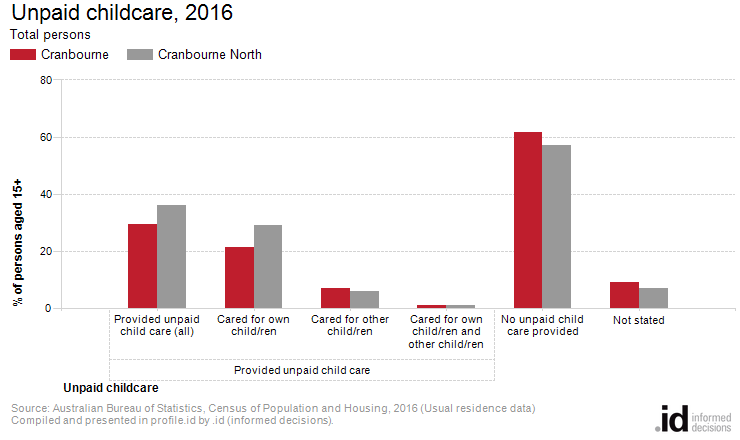
In Cranbourne 4,625 people (29.3% of people aged 15+) provided unpaid care to children in 2016. Of these, 1,264 people were caring for children other than their own.
The role of unpaid childcare in Cranbourne is determined by many different factors. For example areas with high levels of unpaid child care may have a dominance of single income families with one significant earner, or there could be a lack of provision of paid child care in the area. The level to which people care for others children can also indicate the role of extended family (eg. grandparents caring for grandchildren, family day care).
The role of unpaid child care is a complex one so this topic should be viewed in conjunction with several others, including Household Type, Employment, Household Income and Educational Attendance.
Derived from the Census question:
'In the last two weeks did the person spend time looking after a child, without pay?', which specifically asks respondents to differentiate between caring for their own children and caring for others children.
Persons aged 15 years and over.
| Unpaid childcare | ||||||||
|---|---|---|---|---|---|---|---|---|
| Cranbourne - Persons aged 15+ (Usual residence) | 2016 | 2011 | Change | |||||
| Unpaid child care | Number | % | Cranbourne North % | Number | % | Cranbourne North % | 2011 to 2016 | |
| 4,625 | 29.3 | 36.1 | 4,185 | 28.7 | 34.3 | +440 | 12001 | |
| Cared for own child/ren | 3,361 | 21.3 | 29.2 | 3,122 | 21.4 | 26.6 | +239 | 12002 |
| Cared for other child/ren | 1,121 | 7.1 | 5.9 | 956 | 6.5 | 6.8 | +165 | 12003 |
| Cared for own child/ren and other child/ren | 143 | 0.9 | 1.0 | 107 | 0.7 | 0.8 | +36 | 12004 |
| No unpaid child care provided | 9,719 | 61.5 | 56.9 | 9,239 | 63.3 | 59.5 | +480 | 12005 |
| Not stated | 1,447 | 9.2 | 6.9 | 1,181 | 8.1 | 6.2 | +266 | 12006 |
| Total persons aged 15+ | 15,791 | 100.0 | 100.0 | 14,605 | 100.0 | 100.0 | +1,186 | |
Source: Australian Bureau of Statistics, Census of Population and Housing (opens a new window) 2011 and 2016. Compiled and presented by .id (opens a new window)(informed decisions).
Compiled and presented in profile.id by .id (informed decisions).
Compiled and presented in profile.id by .id (informed decisions).
Dominant groups
Analysis of the unpaid child care provided by the population in Cranbourne in 2016 compared to Cranbourne North shows that there was a lower proportion of people who provided unpaid child care either to their own or to other children. Overall, 29.3% of the population provided unpaid child care, compared with 36.1% for Cranbourne North.
The major differences between the share of the population providing unpaid child care in Cranbourne and Cranbourne North were:
- A larger percentage who did not provide care for children (61.5% compared to 56.9%)
- A larger percentage who provided unpaid childcare for other child/ren (7.1% compared to 5.9%)
- A smaller percentage who provided unpaid childcare for own child/ren (21.3% compared to 29.2%)
Emerging groups
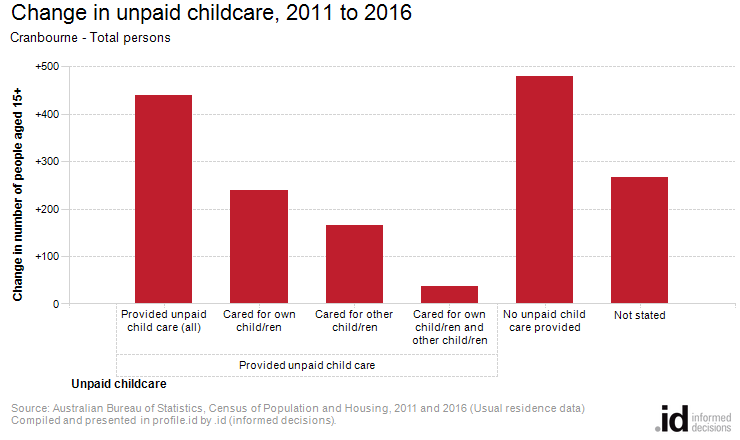
The number of people who provided unpaid child care for their own and/or other people's children in Cranbourne increased by 440 between 2011 and 2016.
The largest changes in the number of people performing unpaid child care in Cranbourne, between 2011 and 2016 were those who:
- Provided no unpaid child care (+480 persons)
- Cared for their own child/ren (+239 persons)
- Cared for other child/ren (+165 persons)