City of Casey
Sexes - Hours worked
51.6% of females in the City of Casey are employed part-time and 46.7% are employed full-time.
Hours Worked statistics show the distribution of employment hours for females and males in the City of Casey's employed population. It relates to the number of hours of paid employment across all jobs in the week prior to Census day.
Hours worked relates to the prevalence of particular types of jobs and particular industries. Some industries are more likely to be part-time. Australia-wide, females are more likely than males to work part-time (<35 hours per week). Males are more likely to work full time and longer hours in paid employment.
The extent to which this varies in the City of Casey can show key differences between sexes and changes in traditional gender roles, as well as the availability of different types of employment.
Please note: Many areas of Australia were in lockdown for the 2021 Census and many people were not working but supported by JobKeeper. For this reason the number of people with zero hours worked in the week prior to Census is likely to have increased between 2016 and 2021, though this varies considerably by place. Use time comparison with cautionHours Worked data should be looked at in conjunction with Employment Status and Occupation.
Derived from the Census question:
'Last week how many hours did the person work in all jobs?'
Total female population aged 15 years and over
| Hours worked | ||||||||
|---|---|---|---|---|---|---|---|---|
| City of Casey - Total employed females aged 15+ | 2021 | 2011 | Change | |||||
| Hours worked | Number | % | Nillumbik Shire - Total females % | Number | % | Nillumbik Shire - Total females % | 2011 to 2021 | |
| None | 4,705 | 5.9 | 6.9 | 2,314 | 4.3 | 4.5 | +2,391 | 22001 |
| 1 hour - 15 hours | 11,393 | 14.3 | 18.0 | 8,162 | 15.3 | 20.3 | +3,231 | 22002 |
| 16 hours - 24 hours | 11,639 | 14.6 | 16.8 | 7,681 | 14.4 | 18.3 | +3,958 | 22003 |
| 25 hours - 34 hours | 13,374 | 16.8 | 16.7 | 7,998 | 15.0 | 16.1 | +5,376 | 22004 |
| 35 hours - 39 hours | 19,516 | 24.5 | 15.3 | 11,732 | 21.9 | 13.2 | +7,784 | 22005 |
| 40 hours | 10,494 | 13.2 | 12.7 | 8,150 | 15.2 | 12.9 | +2,344 | 22006 |
| 41 hours - 48 hours | 3,675 | 4.6 | 5.4 | 3,296 | 6.2 | 6.1 | +379 | 22007 |
| 49 hours or more | 3,555 | 4.5 | 7.3 | 3,015 | 5.6 | 7.1 | +540 | 22008 |
| Not stated | 1,348 | 1.7 | 0.9 | 1,150 | 2.1 | 1.5 | +198 | 22009 |
| Total persons aged 15+ | 79,699 | 100.0 | 100.0 | 53,498 | 100.0 | 100.0 | +26,201 | |
Source: Australian Bureau of Statistics, Census of Population and Housing (opens a new window) 2011 and 2021. Compiled and presented by .id (opens a new window)(informed decisions).
Compiled and presented in profile.id by .id (informed decisions).

Compiled and presented in profile.id by .id (informed decisions).
Dominant groups
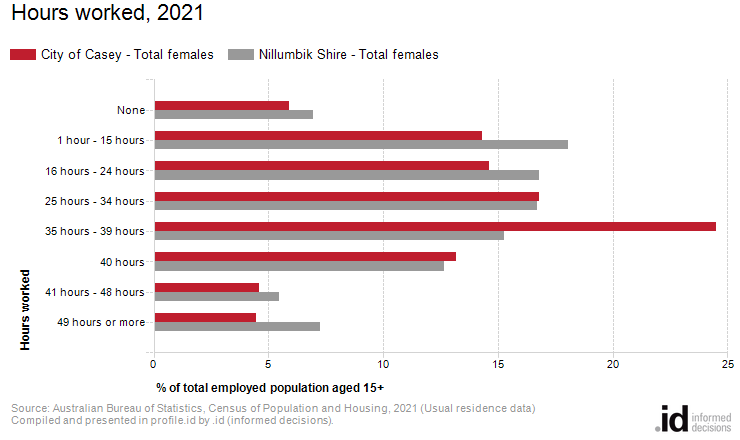
Analysis of the hours worked by the female workforce in the City of Casey in 2021 compared to Nillumbik Shire - Total females shows that there was a lower proportion who worked part-time (34 hours or less) and a higher proportion who worked full-time (35 hours or more).
Overall, 51.6% of the female workforce worked part-time (34 hours or less) and 46.7% worked full-time (35 hours or more), compared with 58.4% and 40.6% respectively for Nillumbik Shire - Total females.
The major differences between the hours worked by females in the City of Casey and Nillumbik Shire - Total females were:
- A larger percentage of females who worked 35 hours - 39 hours (24.5% compared to 15.3%)
- A smaller percentage of females who worked 1 hour - 15 hours (14.3% compared to 18.0%)
- A smaller percentage of females who worked 49 hours or more (4.5% compared to 7.3%)
- A smaller percentage of females who worked 16 hours - 24 hours (14.6% compared to 16.8%)
Emerging groups
The largest changes in the hours worked females the City of Casey between 2011 and 2021 were:
- 35 hours - 39 hours (+7,784 females)
- 25 hours - 34 hours (+5,376 females)
- 16 hours - 24 hours (+3,958 females)
- 1 hour - 15 hours (+3,231 females)